<!DOCTYPE html>
<html lang="en">
<head>
    <meta charset="UTF-8" />
    <meta name="viewport" content="width=device-width, initial-scale=1.0" />
    <meta http-equiv="X-UA-Compatible" content="ie=edge" />
    <title>自定义折线图线条样式及tootip提示信息样式</title>
    <style>
        #chartcontainer {


            margin: 50px auto;
            text-align: center;
        }
    </style>
</head>
<body>
    <div id="chartcontainer"></div>
    <script>
        /*Fixing iframe window.innerHeight 0 issue in Safari*/ document.body
        .clientHeight
    </script>
    <script src="https://gw.alipayobjects.com/os/lib/antv/g2/4.2.8/dist/g2.min.js"></script>
    <script src="https://gw.alipayobjects.com/os/antv/pkg/_antv.data-set-0.11.1/dist/data-set.js"></script>

    <script>
        const data = [
        {

       city: 'London', month: 'Jan', trate: 18.9 },
        {

       city: 'London', month: 'Feb', trate: 28.8 },
        {

       city: 'London', month: 'Mar', trate: 39.3 },
        {

       city: 'London', month: 'Apr', trate: 81.4 },
        {

       city: 'London', month: 'May', trate: 47.1 },
        {

       city: 'London', month: 'Jun', trate: 20.3 },
        {

       city: 'London', month: 'Jul', trate: 24.7 },
        {

       city: 'London', month: 'Aug', trate: 35.6 },
        {

       city: 'Berlin', month: 'Jan', trate: 12.4 },
        {

       city: 'Berlin', month: 'Feb', trate: 23.2 },
        {

       city: 'Berlin', month: 'Mar', trate: 34.5 },
        {

       city: 'Berlin', month: 'Apr', trate: 99.7 },
        {

       city: 'Berlin', month: 'May', trate: 52.6 },
        {

       city: 'Berlin', month: 'Jun', trate: 35.5 },
        {

       city: 'Berlin', month: 'Jul', trate: 37.4 },
        {

       city: 'Berlin', month: 'Aug', trate: 42.4 },
        ]
        // 设置图表
        const chart = new G2.Chart({


              container: 'chartcontainer',
            autoFit: true,//图表是否自适应容器宽高,默认为 false
              height: 500,
            padding: [100, 100, 50, 100],//图表内边距,依次为:上,右,下,左
            pixelRatio:window.devicePixelRatio,//设置设备像素比,默认取浏览器的值 window.devicePixelRatio
            renderer:"canvas",//指定渲染引擎,默认使用 canvas。可选:'canvas' | 'svg'
            // theme:"dark",//配置主题,目前 g2 默认有 dark 主题模式,如需要自定义配置,可以先通过 registerTheme 注册主题,再设置主题 key。
            visible:true,//chart 是否可见,默认为 true,设置为 false 则会隐藏。
          });
          chart.data(data);
        // 设置提示框信息样式
          chart.tooltip({


              showCrosshairs: true,
            shared: true,
            crosshairs:{


                line:{


                    style:{


                            stroke:"#AFEEEE",//辅助线颜色
                            lineWidth:1,//辅助线粗细
                        },
                    }
                },
                domStyles:{


                    'g2-tooltip':{


                        background:"rgba(00, 00, 00,0.2)",//背景RGBA形式的值
                        color:"#7B68EE",//文字颜色
                        boxShadow:"0px 0px 5px #000000",//阴影大小 阴影颜色
                    },
                }
              });
        // 设置Y轴
          chart.axis('trate', {


            // 设置虚线样式
            grid:{


                line:{


                    type:"line",
                    style:{


                                // fill:'#ff0000',
                                stroke:"#000",//网格线颜色
                                opacity:0.3,//网格线透明度
                                lineDash:[1,3],//虚线
                            }
                        }
                    },
                      label: {


                        style:{


                            fill:"#4169E1",///Y轴文字颜色
                            fontFamily: "Microsoft YaHei",///Y轴文字字体
                            fontWeight: 400,///Y轴文字粗细
                            fontSize: 12,///Y轴文字大小
                        },
              formatter: function formatter(val) {

       // 格式化
                  return val + '°C';
              }
          }
      });
        // 自定义图例
        chart.legend('city',{


            clickable: true,
            position: 'top', // 设置图例的显示位置
        })
        // 设置图表折线相关属性【折线样式】
        chart.line()
        .color('city', ["#FFA07A","#90EE90","#2611ff","#26aa99"]).shape('smooth')//曲率
        .position('month*trate') // X轴 * Y轴
        .style({


            lineWidth: 4 // 折线宽度
        })
        .label("trate", {

       // 折线上的值标签
            content: (originData) => {


                        return originData["trate"]+"°C";//设置值标签最终显示的内容
                    },
                    style: {


                        fill: "#A0522D",
                        fontFamily: "Microsoft YaHei",
                        fontWeight: 400,
                        fontSize: 16,
                        // fill: "#ffffff",
                    },
                    position:"top",//显示位置
                })
        chart.render();
    </script>
</body>
</html>
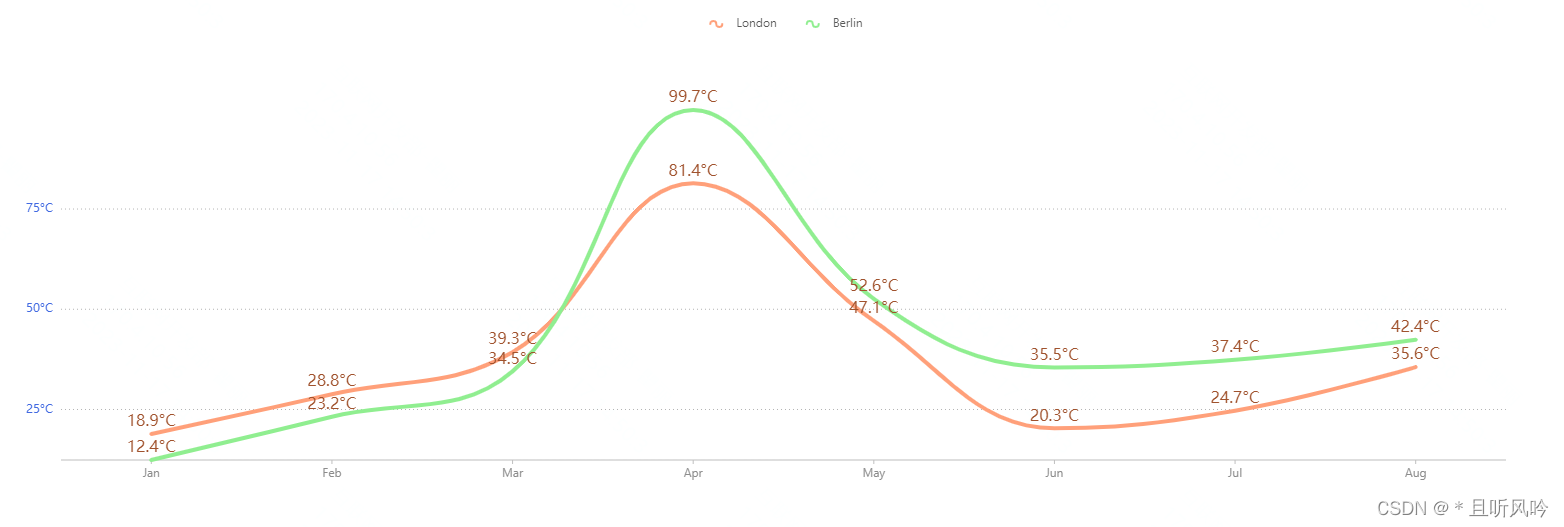
页面效果: