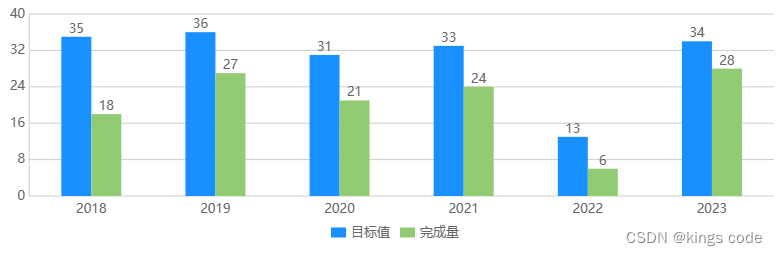
一.柱状图
<template>
<view class="charts-box">
<qiun-data-charts
type="column"
:opts="opts"
:chartData="chartData"
/>
</view>
</template>
<script>
export default {
data() {
return {
chartData: {
},
opts: {
color: ["#1890FF","#91CB74","#FAC858","#EE6666","#73C0DE","#3CA272","#FC8452","#9A60B4","#ea7ccc"],
padding: [15,15,0,5],
enableScroll: false,
legend: {
},
xAxis: {
disableGrid: true
},
yAxis: {
data: [
{
min: 0
}
]
},
extra: {
column: {
type: "group",
width: 30,
activeBgColor: "#000000",
activeBgOpacity: 0.08
}
}
}
};
},
onReady() {
this.getServerData();
},
methods: {
getServerData() {
setTimeout(() => {
let res = {
categories: ["2018","2019","2020","2021","2022","2023"],
series: [
{
name: "目标值",
data: [35,36,31,33,13,34]
},
{
name: "完成量",
data: [18,27,21,24,6,28]
}
]
};
this.chartData = JSON.parse(JSON.stringify(res));
}, 500);
},
}
};
</script>
<style scoped>
.charts-box {
width: 100%;
height: 300px;
}
</style>
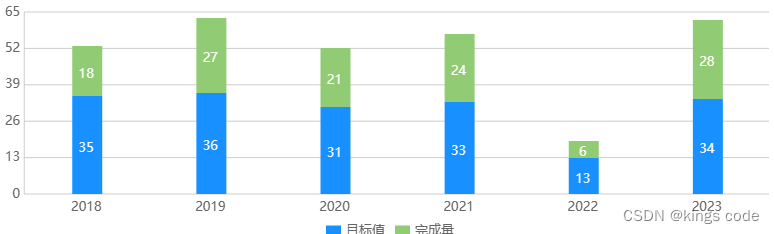
二.改变opts里的extra的type属性便可以改变柱状图的样子
extra: {
column: {
type: "stack",
width: 30,
activeBgColor: "#000000",
activeBgOpacity: 0.08
}
}
1.type改成stack就变成了堆叠柱状图