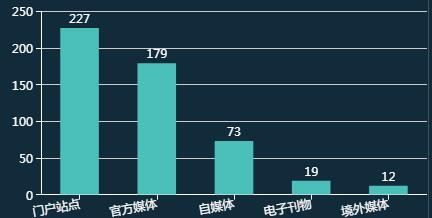
在series 如果已经有itemStyle就在它里面添加
series : [ {

			name : '情报量',
			type : 'bar',
			barWidth : '50%',
			itemStyle : {
				normal : {
					label: {
				          show: true,
				          position: 'top',
				          textStyle: {
				            color: 'white'
				      }
				   }
				},
			},
			data : seriesDataArray
		} ]
如果没有直接写在series中也可以
series : [ {
			name : '情报量',
			type : 'bar',
			barWidth : '50%',
			label: {
			      normal: {
			          show: true,
			          position: 'top',
			          textStyle: {
			            color: 'white'
			          }
			      }
			 },
			data : seriesDataArray,
		} ]
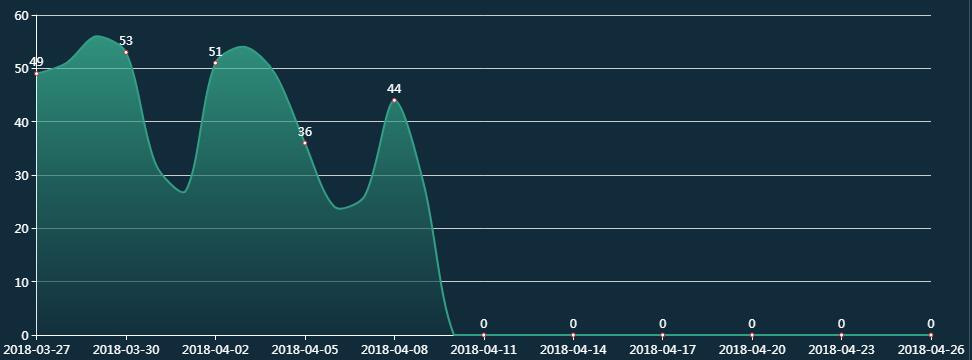
柱状图和折线图都可以,使用方法相同。

