Python数据分析博文汇总
- Pandas重复值处理函数drop_duplicates()
- Pandas数据库缺失值处理函数dropna
- Pandas中slice函数字段抽取
- python数据分析-DataFrame数据框基本知识
- Pandas数据库数据抽取
- Numpy.random.randint()函数用法及源码
- Pandas.concat()函数用法及源码
- Pandas数据框列合并详解
- Pandas.merge()函数用法及源码
- Pandas之数据框框运算
- Pandas之数据标准化
- Pandas.cut函数用法及源码
- python数据框空格值处理
- Pandas.split()函数用法及源码
数据分组:根据数据分析对象的特征,按照一定的数值指标,把数据分析对象划分为不同的区间部分来进行研究,以揭示其内在的联系和规律性。
函数用法:cut(series, bins, right=True, labels=NULL), right=True表示分组右边闭合,right=False表示分组左边闭合,
labels表示分组的自定义标签。
import pandas;
from pandas import read_csv;
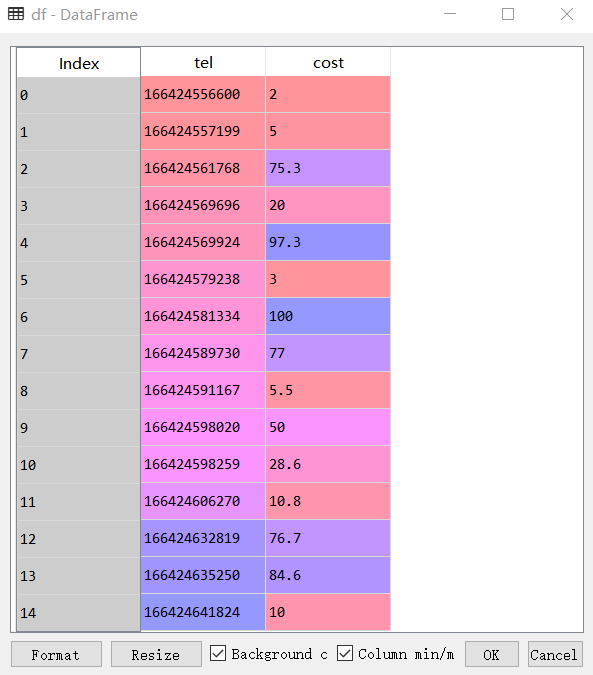
df = read_csv("E:\\pythonlearning\\datacode\\firstpart\\4\\4.15\\data.csv", sep='|');
bins = [min(df.cost)-1, 20, 40, 60, 80, 100, max(df.cost)+1];
labels = ['20以下', '20到40', '40到60', '60到80', '80到100', '100以上'];
pandas.cut(df.cost, bins)#默认右边闭合
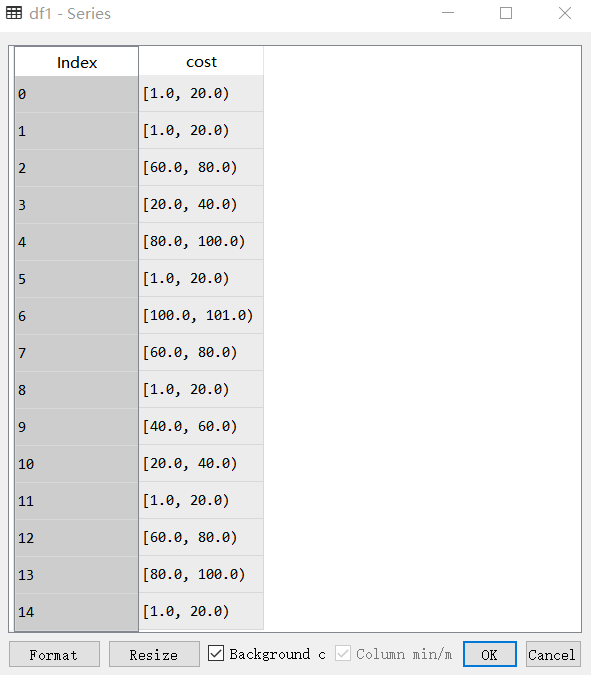
df1=pandas.cut(df.cost, bins, right=False)#左边闭合
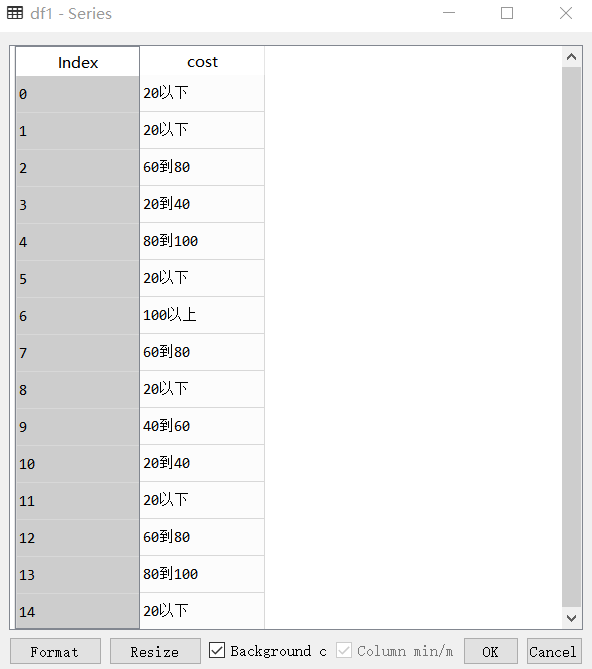
df1=pandas.cut(df.cost, bins, right=False, labels=labels)
df['New']=df1运行前三行得:
运行四、五、六行得:

运行四、五、七行得:
运行第八行得:
源代码:https://download.csdn.net/download/w_weiying/10427108