摘要
本文分别介绍了线性回归、局部加权回归和岭回归。
目录
一、线性回归
1.1 回归
回归是由达尔文的表兄弟Francis Galton发明的。Galton于1877年完成了第一次回归预测,目的是根据上一代豌豆的种子(双亲)的尺寸来预测下一代豌豆种子(孩子)的尺寸(身高)。Galton在大量对象上应用了回归分析,甚至包括人的身高。他得到的结论是:如果双亲的高度比平均高度高,他们的子女也倾向于平均身高但尚不及双亲,这里就可以表述为:孩子的身高向着平均身高回归。Galton在多项研究上都注意到了这一点,并将此研究方法称为回归。
1.2 线性回归
回归的目的是预测数值型数据的目标值,最直接的方法就是根据输入写出一个求出目标值的计算公式,也就是所谓的回归方程,例如 ,其中求回归系数的过程就是回归。那么回归是如何预测的呢?当有了这些回归系数,给定输入,具体的做法就是将回归系数与输入相乘,再将结果加起来就是最终的预测值。说到回归,一般指的都是线性回归,当然也存在非线性回归,在此不做讨论。
假定输入数据存在矩阵
中,而回归系数存放在向量
中。那么对于给定的数据
,预测结果可以通过
给出,那么问题就是来寻找回归系数。一个最常用的方法就是寻找误差最小的
,误差可以用预测的
值和真实的
值的差值表示,由于正负差值的差异,可以选用平方误差,也就是对预测的y值和真实的y值的平方求和,即是
用矩阵可表示为:
现在问题就转换为寻找使得上述矩阵值最小的 ,首先展开:
对于
是一个数,则
运用矩阵求导的知识,对展开式 求导,令其为0,:
即是:
若 可逆,则得:
这就是采用此方法估计出来的
二、局部加权线性回归
2.1 介绍
针对于线性回归存在的欠拟合现象,可以引入一些偏差得到局部加权线性回归对算法进行优化。在该算法中,给待测点附近的每个点赋予一定的权重,进而在所建立的子集上进行给予最小均方差来进行普通的回归,分析可得回归系数
可表示为:
其中 为每个数据点赋予的权重,那么怎样求权重呢,核函数可以看成是求解点与点之间的相似度,在此可以采用核函数,相应的根据预测点与附近点之间的相似程度赋予一定的权重,在此选用最常用的高斯核,则权重可以表示为:
其中 为宽度参数,至于此参数的取值,目前仍没有一个确切的标准,只有一个范围的描述,所以在算法的应用中,可以采用不同的取值分别调试,进而选取最好的结果。
三、岭回归
3.1 介绍
为了解决上述问题,统计学家引入了“岭回归”的概念。简单说来,岭回归就是在矩阵
上加上一个
,从而使得矩阵非奇异,从而能对
求逆。其中矩阵
为一个m*m的单位矩阵,对角线上的元素全为1,其他元素全为0,而λ是一个用户定义的数值,这种情况下,回归系数的计算公式将变为:
其中 是一个单位矩阵。
岭回归就是用了单位矩阵乘以常量 ,因为只I贯穿了整个对角线,其余元素为0,形象的就是在0构成的平面上有一条1组成的“岭”,这就是岭回归中岭的由来。
岭回归最先是用来处理特征数多与样本数的情况,现在也用于在估计中加入偏差,从而得到更好的估计。这里引入λ限制了所有 的和,通过引入该惩罚项,能够减少不重要的参数,这个技术在统计学上也叫做缩减。缩减方法可以去掉不重要的参数,因此能更好的理解数据。在此,选取不同的 进行测试,最后得到一个使得误差最小的 。
四、效果对比
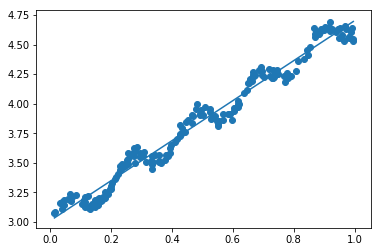
图1 线性回归
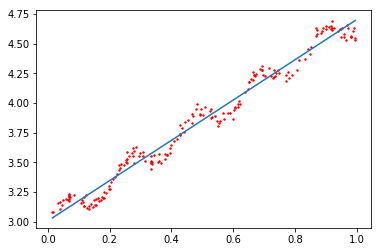
图2 局部加权线性回归,k = 1
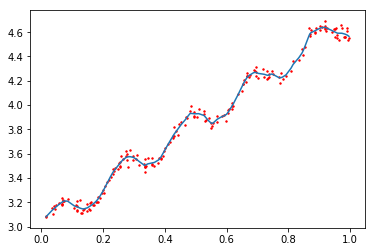
图3 局部加权线性回归,k = 0.01
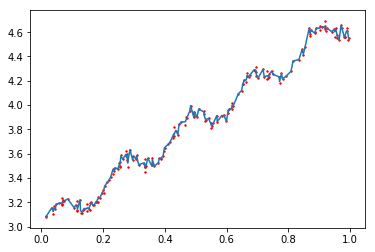
图4 局部加权线性回归,k = 0.002
可以看出,当k = 1时,结果和线性回归使用最小二乘法的结果相似,而k=0.001时噪声太多,属于过拟合的情况,相比之下,k = 0.01得到的结果更理想。
虽然LWLR得到了较为理想的结果,但是此种方法的缺点是在对每个点进行预测时都必须遍历整个数据集,这样无疑是增加了工作量,并且该方法中的的宽度参数的取值对于结果的影响也是蛮大的。同时,当数据的特征比样本点还多当然是用线性回归和之前的方法是不能实现的,当特征比样本点还多时,表明输入的矩阵X不是一个满秩矩阵,在计算
时会出错。
五、总结
与分类一样,回归是预测目标值的过程。回归与分类的不同在于回归预测的是连续型变量,而分类预测的是离散型的变量。回归是统计学中最有力的工具之一。如果给定输入矩阵 ,如果 存在的话回归法可以直接使用,回归方程中的求得特征对应的最佳回归系数的方法是最小化误差的平方和,判断回归结果的好坏可以利用预测值和真实值之间的相关性判断。当数据样本总个数少于特征总数时,对于矩阵 , 不能直接计算,这时可以考虑岭回归。
六、参考文献
[1]周志华.机器学习[M].北京:清华大学出版社,2016.
[2]Peter Harrington.机器学习实战[M].北京:人民邮电出版社,2013.
[3]韩家炜等.数据挖掘概念与技术[M].北京:机械工业出版社,2012.
七、附录
《机器学习实战》的代码,其代码的资源网址为:
https://www.manning.com/books/machine-learning-in-action
其中,regression.py文件为:
# -*- coding: utf-8 -*-
"""
Created on Sun Jun  3 17:25:45 2018

@author: Diky
"""
"""

                       .::::.
                     .::::::::.
                    :::::::::::
                 ..:::::::::::'
              '::::::::::::'
                .::::::::::
           '::::::::::::::..
                ..::::::::::::.
              ``::::::::::::::::
               ::::``:::::::::'        .:::.
              ::::'   ':::::'       .::::::::.
            .::::'      ::::     .:::::::'::::.
           .:::'       :::::  .:::::::::' ':::::.
          .::'        :::::.:::::::::'      ':::::.
         .::'         ::::::::::::::'         ``::::.
     ...:::           ::::::::::::'              ``::.
    ```` ':.          ':::::::::'                  ::::..
                       '.:::::'                    ':'````..

"""

from numpy import *

def loadDataSet(fileName):      #general function to parse tab -delimited floats
    numFeat = len(open(fileName).readline().split('\t')) - 1 #get number of fields
    dataMat = []; labelMat = []
    fr = open(fileName)
    for line in fr.readlines():
        lineArr =[]
        curLine = line.strip().split('\t')
        for i in range(numFeat):
            lineArr.append(float(curLine[i]))
        dataMat.append(lineArr)
        labelMat.append(float(curLine[-1]))
    return dataMat,labelMat

def standRegres(xArr,yArr):
    xMat = mat(xArr); yMat = mat(yArr).T
    xTx = xMat.T*xMat
    if linalg.det(xTx) == 0.0:
        print( "This matrix is singular, cannot do inverse")
        return
    ws = xTx.I * (xMat.T*yMat)
    return ws

def lwlr(testPoint,xArr,yArr,k=1.0):
    xMat = mat(xArr); yMat = mat(yArr).T
    m = shape(xMat)[0]
    weights = mat(eye((m)))
    for j in range(m):                      #next 2 lines create weights matrix
        diffMat = testPoint - xMat[j,:]     #
        weights[j,j] = exp(diffMat*diffMat.T/(-2.0*k**2))
    xTx = xMat.T * (weights * xMat)
    if linalg.det(xTx) == 0.0:
        print( "This matrix is singular, cannot do inverse")
        return
    ws = xTx.I * (xMat.T * (weights * yMat))
    return testPoint * ws

def lwlrTest(testArr,xArr,yArr,k=1.0):  #loops over all the data points and applies lwlr to each one
    m = shape(testArr)[0]
    yHat = zeros(m)
    for i in range(m):
        yHat[i] = lwlr(testArr[i],xArr,yArr,k)
    return yHat

def lwlrTestPlot(xArr,yArr,k=1.0):  #same thing as lwlrTest except it sorts X first
    yHat = zeros(shape(yArr))       #easier for plotting
    xCopy = mat(xArr)
    xCopy.sort(0)
    for i in range(shape(xArr)[0]):
        yHat[i] = lwlr(xCopy[i],xArr,yArr,k)
    return yHat,xCopy

def rssError(yArr,yHatArr): #yArr and yHatArr both need to be arrays
    return ((yArr-yHatArr)**2).sum()

def ridgeRegres(xMat,yMat,lam=0.2):
    xTx = xMat.T*xMat
    denom = xTx + eye(shape(xMat)[1])*lam
    if linalg.det(denom) == 0.0:
        print( "This matrix is singular, cannot do inverse")
        return
    ws = denom.I * (xMat.T*yMat)
    return ws

def ridgeTest(xArr,yArr):
    xMat = mat(xArr); yMat=mat(yArr).T
    yMean = mean(yMat,0)
    yMat = yMat - yMean     #to eliminate X0 take mean off of Y
    #regularize X's
    xMeans = mean(xMat,0)   #calc mean then subtract it off
    xVar = var(xMat,0)      #calc variance of Xi then divide by it
    xMat = (xMat - xMeans)/xVar
    numTestPts = 30
    wMat = zeros((numTestPts,shape(xMat)[1]))
    for i in range(numTestPts):
        ws = ridgeRegres(xMat,yMat,exp(i-10))
        wMat[i,:]=ws.T
    return wMat

def regularize(xMat):#regularize by columns
    inMat = xMat.copy()
    inMeans = mean(inMat,0)   #calc mean then subtract it off
    inVar = var(inMat,0)      #calc variance of Xi then divide by it
    inMat = (inMat - inMeans)/inVar
    return inMat

def stageWise(xArr,yArr,eps=0.01,numIt=100):
    xMat = mat(xArr); yMat=mat(yArr).T
    yMean = mean(yMat,0)
    yMat = yMat - yMean     #can also regularize ys but will get smaller coef
    xMat = regularize(xMat)
    m,n=shape(xMat)
    #returnMat = zeros((numIt,n)) #testing code remove
    ws = zeros((n,1)); wsTest = ws.copy(); wsMax = ws.copy()
    for i in range(numIt):
        print (ws.T)
        lowestError = inf;
        for j in range(n):
            for sign in [-1,1]:
                wsTest = ws.copy()
                wsTest[j] += eps*sign
                yTest = xMat*wsTest
                rssE = rssError(yMat.A,yTest.A)
                if rssE < lowestError:
                    lowestError = rssE
                    wsMax = wsTest
        ws = wsMax.copy()
        #returnMat[i,:]=ws.T
    #return returnMat

#def scrapePage(inFile,outFile,yr,numPce,origPrc):
#    from BeautifulSoup import BeautifulSoup
#    fr = open(inFile); fw=open(outFile,'a') #a is append mode writing
#    soup = BeautifulSoup(fr.read())
#    i=1
#    currentRow = soup.findAll('table', r="%d" % i)
#    while(len(currentRow)!=0):
#        title = currentRow[0].findAll('a')[1].text
#        lwrTitle = title.lower()
#        if (lwrTitle.find('new') > -1) or (lwrTitle.find('nisb') > -1):
#            newFlag = 1.0
#        else:
#            newFlag = 0.0
#        soldUnicde = currentRow[0].findAll('td')[3].findAll('span')
#        if len(soldUnicde)==0:
#            print "item #%d did not sell" % i
#        else:
#            soldPrice = currentRow[0].findAll('td')[4]
#            priceStr = soldPrice.text
#            priceStr = priceStr.replace('$','') #strips out $
#            priceStr = priceStr.replace(',','') #strips out ,
#            if len(soldPrice)>1:
#                priceStr = priceStr.replace('Free shipping', '') #strips out Free Shipping
#            print "%s\t%d\t%s" % (priceStr,newFlag,title)
#            fw.write("%d\t%d\t%d\t%f\t%s\n" % (yr,numPce,newFlag,origPrc,priceStr))
#        i += 1
#        currentRow = soup.findAll('table', r="%d" % i)
#    fw.close()

from time import sleep
import json
import urllib.request
def searchForSet(retX, retY, setNum, yr, numPce, origPrc):
    sleep(10)
    myAPIstr = 'AIzaSyD2cR2KFyx12hXu6PFU-wrWot3NXvko8vY'
    searchURL = 'https://www.googleapis.com/shopping/search/v1/public/products?key=%s&country=US&q=lego+%d&alt=json' % (myAPIstr, setNum)
    pg = urllib2.urlopen(searchURL)
    retDict = json.loads(pg.read())
    for i in range(len(retDict['items'])):
        try:
            currItem = retDict['items'][i]
            if currItem['product']['condition'] == 'new':
                newFlag = 1
            else: newFlag = 0
            listOfInv = currItem['product']['inventories']
            for item in listOfInv:
                sellingPrice = item['price']
                if  sellingPrice > origPrc * 0.5:
                    print("%d\t%d\t%d\t%f\t%f" % (yr,numPce,newFlag,origPrc, sellingPrice))
                    retX.append([yr, numPce, newFlag, origPrc])
                    retY.append(sellingPrice)
        except: print ('problem with item %d' % i)

def setDataCollect(retX, retY):
    searchForSet(retX, retY, 8288, 2006, 800, 49.99)
    searchForSet(retX, retY, 10030, 2002, 3096, 269.99)
    searchForSet(retX, retY, 10179, 2007, 5195, 499.99)
    searchForSet(retX, retY, 10181, 2007, 3428, 199.99)
    searchForSet(retX, retY, 10189, 2008, 5922, 299.99)
    searchForSet(retX, retY, 10196, 2009, 3263, 249.99)

def crossValidation(xArr,yArr,numVal=10):
    m = len(yArr)
    indexList = range(m)
    errorMat = zeros((numVal,30))#create error mat 30columns numVal rows
    for i in range(numVal):
        trainX=[]; trainY=[]
        testX = []; testY = []
        random.shuffle(indexList)
        for j in range(m):#create training set based on first 90% of values in indexList
            if j < m*0.9:
                trainX.append(xArr[indexList[j]])
                trainY.append(yArr[indexList[j]])
            else:
                testX.append(xArr[indexList[j]])
                testY.append(yArr[indexList[j]])
        wMat = ridgeTest(trainX,trainY)    #get 30 weight vectors from ridge
        for k in range(30):#loop over all of the ridge estimates
            matTestX = mat(testX); matTrainX=mat(trainX)
            meanTrain = mean(matTrainX,0)
            varTrain = var(matTrainX,0)
            matTestX = (matTestX-meanTrain)/varTrain #regularize test with training params
            yEst = matTestX * mat(wMat[k,:]).T + mean(trainY)#test ridge results and store
            errorMat[i,k]=rssError(yEst.T.A,array(testY))
            #print errorMat[i,k]
    meanErrors = mean(errorMat,0)#calc avg performance of the different ridge weight vectors
    minMean = float(min(meanErrors))
    bestWeights = wMat[nonzero(meanErrors==minMean)]
    #can unregularize to get model
    #when we regularized we wrote Xreg = (x-meanX)/var(x)
    #we can now write in terms of x not Xreg:  x*w/var(x) - meanX/var(x) +meanY
    xMat = mat(xArr); yMat=mat(yArr).T
    meanX = mean(xMat,0); varX = var(xMat,0)
    unReg = bestWeights/varX
    print ("the best model from Ridge Regression is:\n",unReg)
    print ("with constant term: ",-1*sum(multiply(meanX,unReg)) + mean(yMat))
测试main,py文件为:
# -*- coding: utf-8 -*-
"""
Created on Sun Jun  3 17:25:45 2018

@author: Diky
"""

from regression import *
from numpy import *
xArr, yArr = loadDataSet('ex0.txt')
ws = standRegres(xArr, yArr)
xMat = mat(xArr)
yMat = mat(yArr)
yHat = xMat*ws

import matplotlib.pyplot as plt
fig = plt.figure()
ax = fig.add_subplot(111)
ax.scatter(xMat[:,1].flatten().A[0], yMat.T[:,0].flatten().A[0])

xCopy = xMat.copy()
xCopy.sort(0)
yHat = xCopy*ws
ax.plot(xCopy[:,1], yHat)

plt.show()

yHat = xMat*ws


xArr, yArr = loadDataSet('ex0.txt')

yHat = lwlrTest(xArr, xArr, yArr, k=0.002)
# 对xArr排序
srtInd = xMat[:,1].argsort(0)
xSort = xMat[srtInd][:,0,:]

import matplotlib.pyplot as plt
fig = plt.figure()
ax = fig.add_subplot(111)
ax.plot(xSort[:,1], yHat[srtInd])

ax.scatter(xMat[:,1].flatten().A[0], yMat.T[:,0].flatten().A[0], s=2, c='red')

plt.show()