目前正在做Tone-mapping相关工作,一点点笔记与大家分享一下!!!欢迎大家批评指正!!!
目前关于tone-mapped image quality 的databases 有两个数据库:(1)TMID database[1];(2)ESPL-LIVE HDR image quality database [2]。第一个数据库是由加拿大滑铁卢大学建立的,其包含了8幅HDR图像和由8个tone-mapping operators (TMOs)生成的120幅LDR图像,分数范围是1~8,1表示质量最好,8表示质量最差。第二个数据库是由美国德克萨斯大学奥斯汀分校建立的,其包含了1811幅LDR图像,数据库中有3中失真类型:(a)749幅tone-mapped images,(b)708幅multi-exposure fusion images,and (c)354幅post processed images。
1.1 Tone-mapped Images简介
由于HDR图像的动态范围高达10的8次方,而传统显示器只能显示0~255的亮度级图像,为了能够在传统显示器上显示HDR 图像,就必须降低HDR的动态范围,所以就有了Tone-mapping技术。目的就是将HDR图像所包含的内容能够在传统显示器上可视化。如下图所示:

注:左图中,上方为压缩后的HDR图像,下方为直接用相机拍摄的图像。高动态范围图像(HDR),相比普通的图像,可以提供更多的动态范围和图像细节,根据不同的曝光时间的LDR图像,利用每个曝光时间相对应最佳细节的LDR图像来合成最终HDR图像,能够更好的反映出真实环境中的视觉效果。
右图为生成LDR图像流程。
1.2 相关tone-mapped IQA工作
当前关于tone-mapped images quality assessment 的文章并不是很多,下面就介绍一下最新发表论文。
1.2.1 Blind quality assessment of tone-mapped images via analysis of information, naturalness, and structure
文章框架:Features + SVR
特征包括三部分:
1)Information: 首先对Tone-mapped图像进行变换,表达式为:
其中, M的取值为{1, n, | n= 3.5,5,6.5,8} ,一共有9个取值。 每一种变换可以得到一种feature map, 计算整幅图像的entropy值
,并将图像进行分成72*72的块,计算得到每一块的entropy的值,再平均,得到
。
2) Naturalness: 将图像分成11*11的块,计算块的均值和方差,再计算所有块均值和方差的均值,使用3000张质量完好的图像,提取图像的均值和方差特征,观察得知,其符合类高斯模型。分别拟合得到一个函数,得到图像的均值和方差,可以得到两个概率值,取较小者,表示Naturalness。
3)Structure:使用Sobel operator计算梯度图,给定一个阈值,对梯度图进行分割,得到一张二值图,计算该二值图的均值,表示structure。
1.2.2 Blind Tone-Mapped Image Quality Assessment Based on Brightest/Darkest Regions, Naturalness and Aesthetics
文章框架:Features+randomforest (RF)
特征分为三部分:
(1)Detail information Features (Brightest/Darkest regions extraction)(:7维):提取图像的整体detail information entropy以及从图像最亮和最暗区域提取detail information entropy以评估局部细节失真。
(2)Naturalness Features (:5维):从尺寸为M×N的tone-mapped图像中的亮度图L中提取的归一化亮度系数(normalized luminance coefficients,NLC)图,定义如下:

此外,基于 yellow channel 提取特征,定义如下:
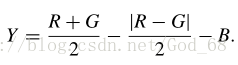
最后, NLC符合GGD分布,取模型参数 (,
) 及NLC图的kurtosis 和 skewness作为特征值(
),取在yellow channel图中GGD模型参数
作为特征(
)。
(3)Aesthetic Features (:18维):将图像分为9个块,图(a)为LDR图像,图(b)表示为亮度图,图(c)表示饱和度(saturation)图,示例来自于论文。

亮度特征9维()以及饱和度特征(
)。表达式如下:

其中, 表示图像块的个数,
表示图像块中像素个数,
表示图像块中像素总数量,
和
分别表示第
个块中第
个像素的亮度值和饱和度值,
和
分别表示第
个块中的亮度值和饱和度值。
1.2.3 No reference quality assessment of tone-mapped HDR pictures
文章框架:Features+SVR
1) Spatial: Shape and scale parameters of the GGD fitted to the MSCN coefficients()
2) Spatial: Shape and scale parameters of the GGD fitted to the log-derivative ofthe seven types of neighbors ()
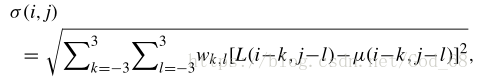
3) Spatial: Two parameters extracted from the σ field ()
4) Gradient: Shape and scale parameters of the GGD fitted to the MSCN coefficientsof gradient magnitude field ()
5) Gradient: Shape and scale parameters of the GGD fitted to the log0derivative ofthe seven types of neighbors of gradient magnitude field ()
6) Gradient: Two parameters extracted from the σ field of gradient magnitude field ()
7) Gradient: Mean, standard deviation, skewness, and kurtosis of gradientstructure tensor ()
1.2.4 Blind Quality Assessment of Tone-Mapped Images Considering Colorfulness, Naturalness and Structure
文章框架:Features+SVR
特征分为三部分:
(1)Image Colorfulness:一幅图像被分割成多个块,从而得到大量的局部对比度。基于块的对比度的均值和方差值估计局部图像的色彩鲜艳度。均值反映整体趋势,方差代表局部对比度的波动。为此,可以获得全局色彩鲜艳度和局部色彩鲜艳度。
(2)Image Naturalness:mean subtracted contrast normalized (MSCN) coefficients 和 image gradient magnitude
(3)Image Structure:使用gradient map 和 edge map表示图像结构信息。
1.3 总结
目前对于tone-mapped的IQA 工作不够多,而且手工特征提取基本上都集中于纹理、亮度、信息量、颜色特征,对于TMO产生的特有失真并没有得到很好地解决,比如晕影。
参考文献 :
- H. Yeganeh and Z. Wang, ‘‘Objective quality assessment of tone-mapped images,’’ IEEE Trans. Image Process., vol. 22, no. 2, pp. 657–667, Feb. 2013.
- D. Kundu, D. Ghadiyaram, A. Bovik, and B. Evans, “Large-scale crowdsourced study for tone-mapped HDR pictures.” IEEE Transactions on Image Processing, vol. 26, no. 10, pp. 4725–4740, Oct. 2017.
- G. Jiang, H. Song, M. Yu, Y. Song, and Z. Peng, “Blind tone-mapped image quality assessment based on brightest/darkest regions, naturalness and aesthetics,” IEEE Access, vol. 6, pp. 2231–2240, 2018.
- K. Gu, S. Wang, G. Zhai, and S. Ma, “Blind quality assessment of tone-mapped images via analysis of information, naturalness, and structure,”IEEE Transactions on Multimedia, vol. 18, no. 3, pp. 432–443, 2016.
- G. Yue, C. Hou, and T. Zhou,“Blind Quality Assessment of Tone-Mapped Images Considering Colorfulness, Naturalness and Structure,” IEEE Transactions on Industrial Electronics, PP, 2018.