一、需求
1、由于我们项目中有个页面,需要统计分析的功能
2、所以才想到vue中引用echart组件(备注:我们是利用vue-cli脚手架,初始化vue项目)
二、如何实现这个需求
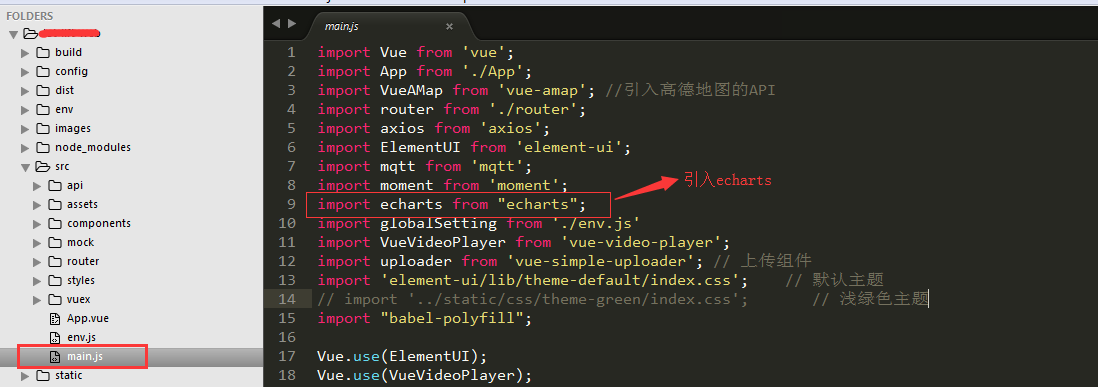
1、引入Echart包,通过以下命令安装Echarts
![]()
2、写一个环形图的子组件
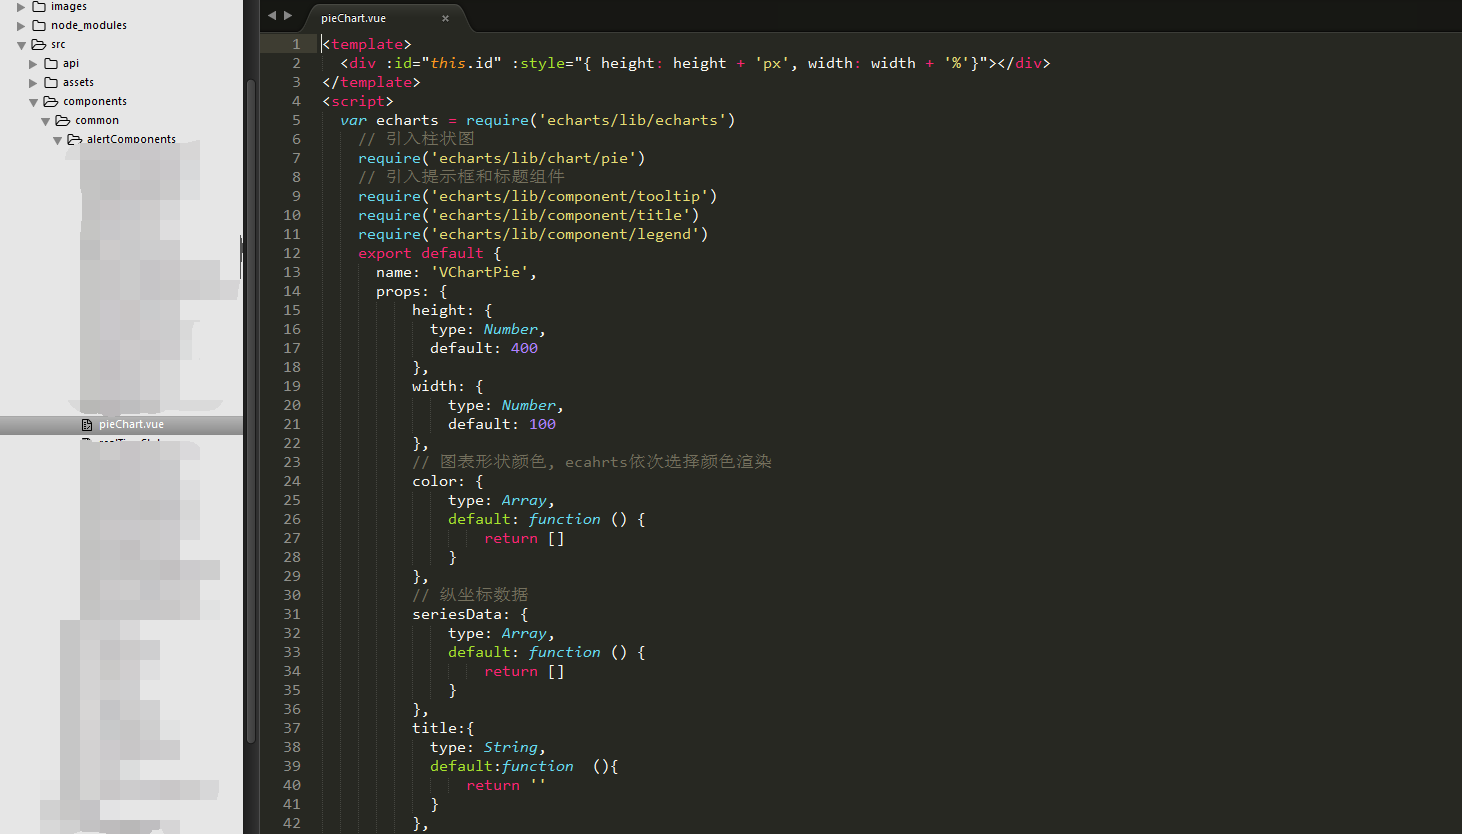
该组件比较全的代码如下:
<template>
    <div :id="this.id" :style="{ height: height + 'px', width: width + '%'}"></div>
</template>
<script>
    var echarts = require('echarts/lib/echarts')
      // 引入柱状图
      require('echarts/lib/chart/pie')
      // 引入提示框和标题组件
      require('echarts/lib/component/tooltip')
      require('echarts/lib/component/title')
      require('echarts/lib/component/legend')
      export default {
          name: 'VChartPie',
          props: {
                height: {
                type: Number,
                default: 400
              },
          width: {
              type: Number,
              default: 100
          },
              // 图表形状颜色, ecahrts依次选择颜色渲染
              color: {
                  type: Array,
                  default: function () {
                      return []
                  }
              },
              // 纵坐标数据
              seriesData: {
                  type: Array,
                  default: function () {
                      return []
                  }
              },
          title:{
            type: String,
            default:function  (){
                return ''
            }
          },
          orient:{
            type: String,
            default:function  (){
                return 'vertical'
            }
          },
          legendTop: {
            type: Number,
            default: 40
          },
          legendRight: {
            type: Number,
            default: 4
          },
          itemGap: {
            type: Number,
            default: 8
          },
          radius:{
              type: Array,
              default: function () {
                  return []
              }
          },
          center:{
              type: Array,
              default: function () {
                  return []
              }
          }
          },
        data() {
            return {
            }
        },
        computed: {
            // 生成一个随机id, 实现图表组件的复用
            id: function () {
                return parseInt(Math.random() * 1000000)
            },
            legendData: function () {
                let legendData = []
                this.seriesData.forEach(function (elem) {
                    legendData.push(elem.name)
                })
                return legendData
            }
        },
        methods: {
            renderPieChart: function () {
                if (this.chart) {
                    this.chart.dispose()
                }
                // 初始化echart
                this.chart = echarts.init(document.getElementById(this.id))
                // 自定义eChart样式 官方配置指南(http://echarts.baidu.com/option.html#yAxis.splitLine.lineStyle.color)
                this.chart.setOption({
            title:{
                text:this.title,
                textStyle: {
                    fontSize:16,
                    fontWeight:100,
                },
            },
                    legend: {
                          icon: 'stack',
                          data: this.legendData,
                          itemGap: this.itemGap,
                          itemWidth: 12,
                        itemHeight: 12,
                      top: this.legendTop,
                          right:this.legendRight,
              orient: this.orient,
                      },
                    grid: {
                        left: 0,
                        right: 20
                    },
                    color: this.color,
            tooltip: {},
                    series: {
                        type: 'pie',
                radius: this.radius,
                        data: this.seriesData,
                labelLine: {
                    normal: {
                        show: false
                    }
                },
                label: {
                  normal: {
                      show: false,
                  }
                },
                center: this.center,
                    }
                })
              }
        },
        watch: {
            seriesData(){
                this.renderPieChart()
            }
        },
        mounted() {
            this.renderPieChart()
        }
      }
</script>
3、在父组件中引用子组件
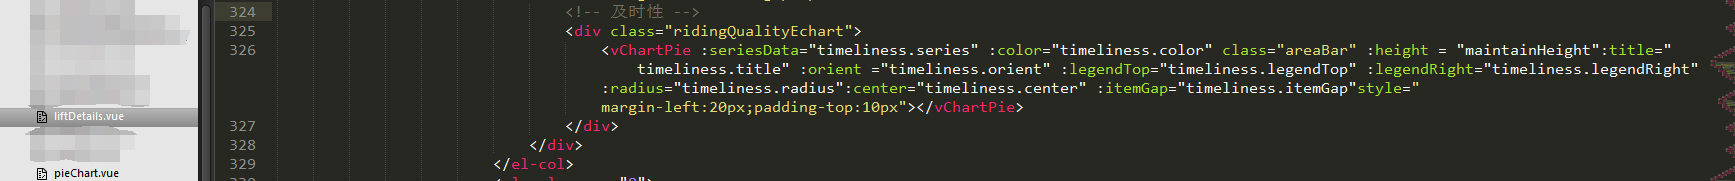
该父组件中比较全的代码如下:
<template>
        <el-row>
            <el-col :span="8">
                <div class="grid-content bg-purple maintainInfo">
                      <!-- 及时性 -->
                      <div class="ridingQualityEchart">
                           <vChartPie :seriesData="timeliness.series" :color="timeliness.color" class="areaBar" :height = "maintainHeight":title="timeliness.title" :orient ="timeliness.orient" :legendTop="timeliness.legendTop" :legendRight="timeliness.legendRight":radius="timeliness.radius":center="timeliness.center" :itemGap="timeliness.itemGap"style="margin-left:20px;padding-top:10px"></vChartPie>
                      </div>
                 </div>
             </el-col>
        </el-row>
</template>
<script>
import vChartPie from './pieChart.vue'
export default {
        data() {
              return {
                    timeliness:{
                        title:'及时性:',
                        radius: ['35%', '55%'],
                        center:['34%','51%'],
                        orient:'vertical',
                        legendTop:200,
                        legendRight:105,
                        itemGap:35,
                        series: [
                            {value:335, name:'及时'},
                            {value:100, name:'不及时'}
                        ],
                        color:['#289df5', '#fbc01b'],
                    }
              }
        },
       components:{
            vChartPie
        },
        created(){
            this.getMaintainData();
        },
        methods:{
             getMaintainData(){
                 let self = this;
                 self.$axios.post('你的接口'+'&startTime='+ self.startDate.getTime()+'&endTime='+ self.endDate.getTime()).then((res) => {
                     let onTime = res.data.data.onTime;
                     self.timeliness.series = [];
                     onTime.forEach(function(item){
                         self.timeliness.series.push(item);
                     })
                 });
             }
        }
}
</script>
运行后的效果如下:
