安装pygal库
首先创建一个骰子的类:
from random import randint
class Die():
    """表示一个骰子的类"""
    def __init__(self, num_sides = 6):
        """色子默认6面"""
        self.num_sides = num_sides
    def roll(self):
        """方法roll返回一个位于1和骰子面数之间的随机值"""
        return randint(1, self.num_sides)
来一个简单的6面骰子,投掷10000次并将频数结果可视化
from die import Die
import pygal
# 创建一个6面骰子的实例
die_6 = Die()
num_throw = 10000
results = [die_6.roll() for i in range(num_throw)]
frequencies = [results.count(value) for value in range(1,die_6.num_sides+1)]
hist = pygal.Bar()
hist.title = "Frequencies of 6-sides throw %d times" % num_throw
hist.x_lables = list(range(1,die_6.num_sides+1))
hist.x_title = "Result"
hist.y_title = "Frequencies of each value"
hist.add("D6",frequencies)
hist.render_to_file("D6_%d.svg" % num_throw)
hist.render_to_png("D6_%d.png" % num_throw)
看下结果:
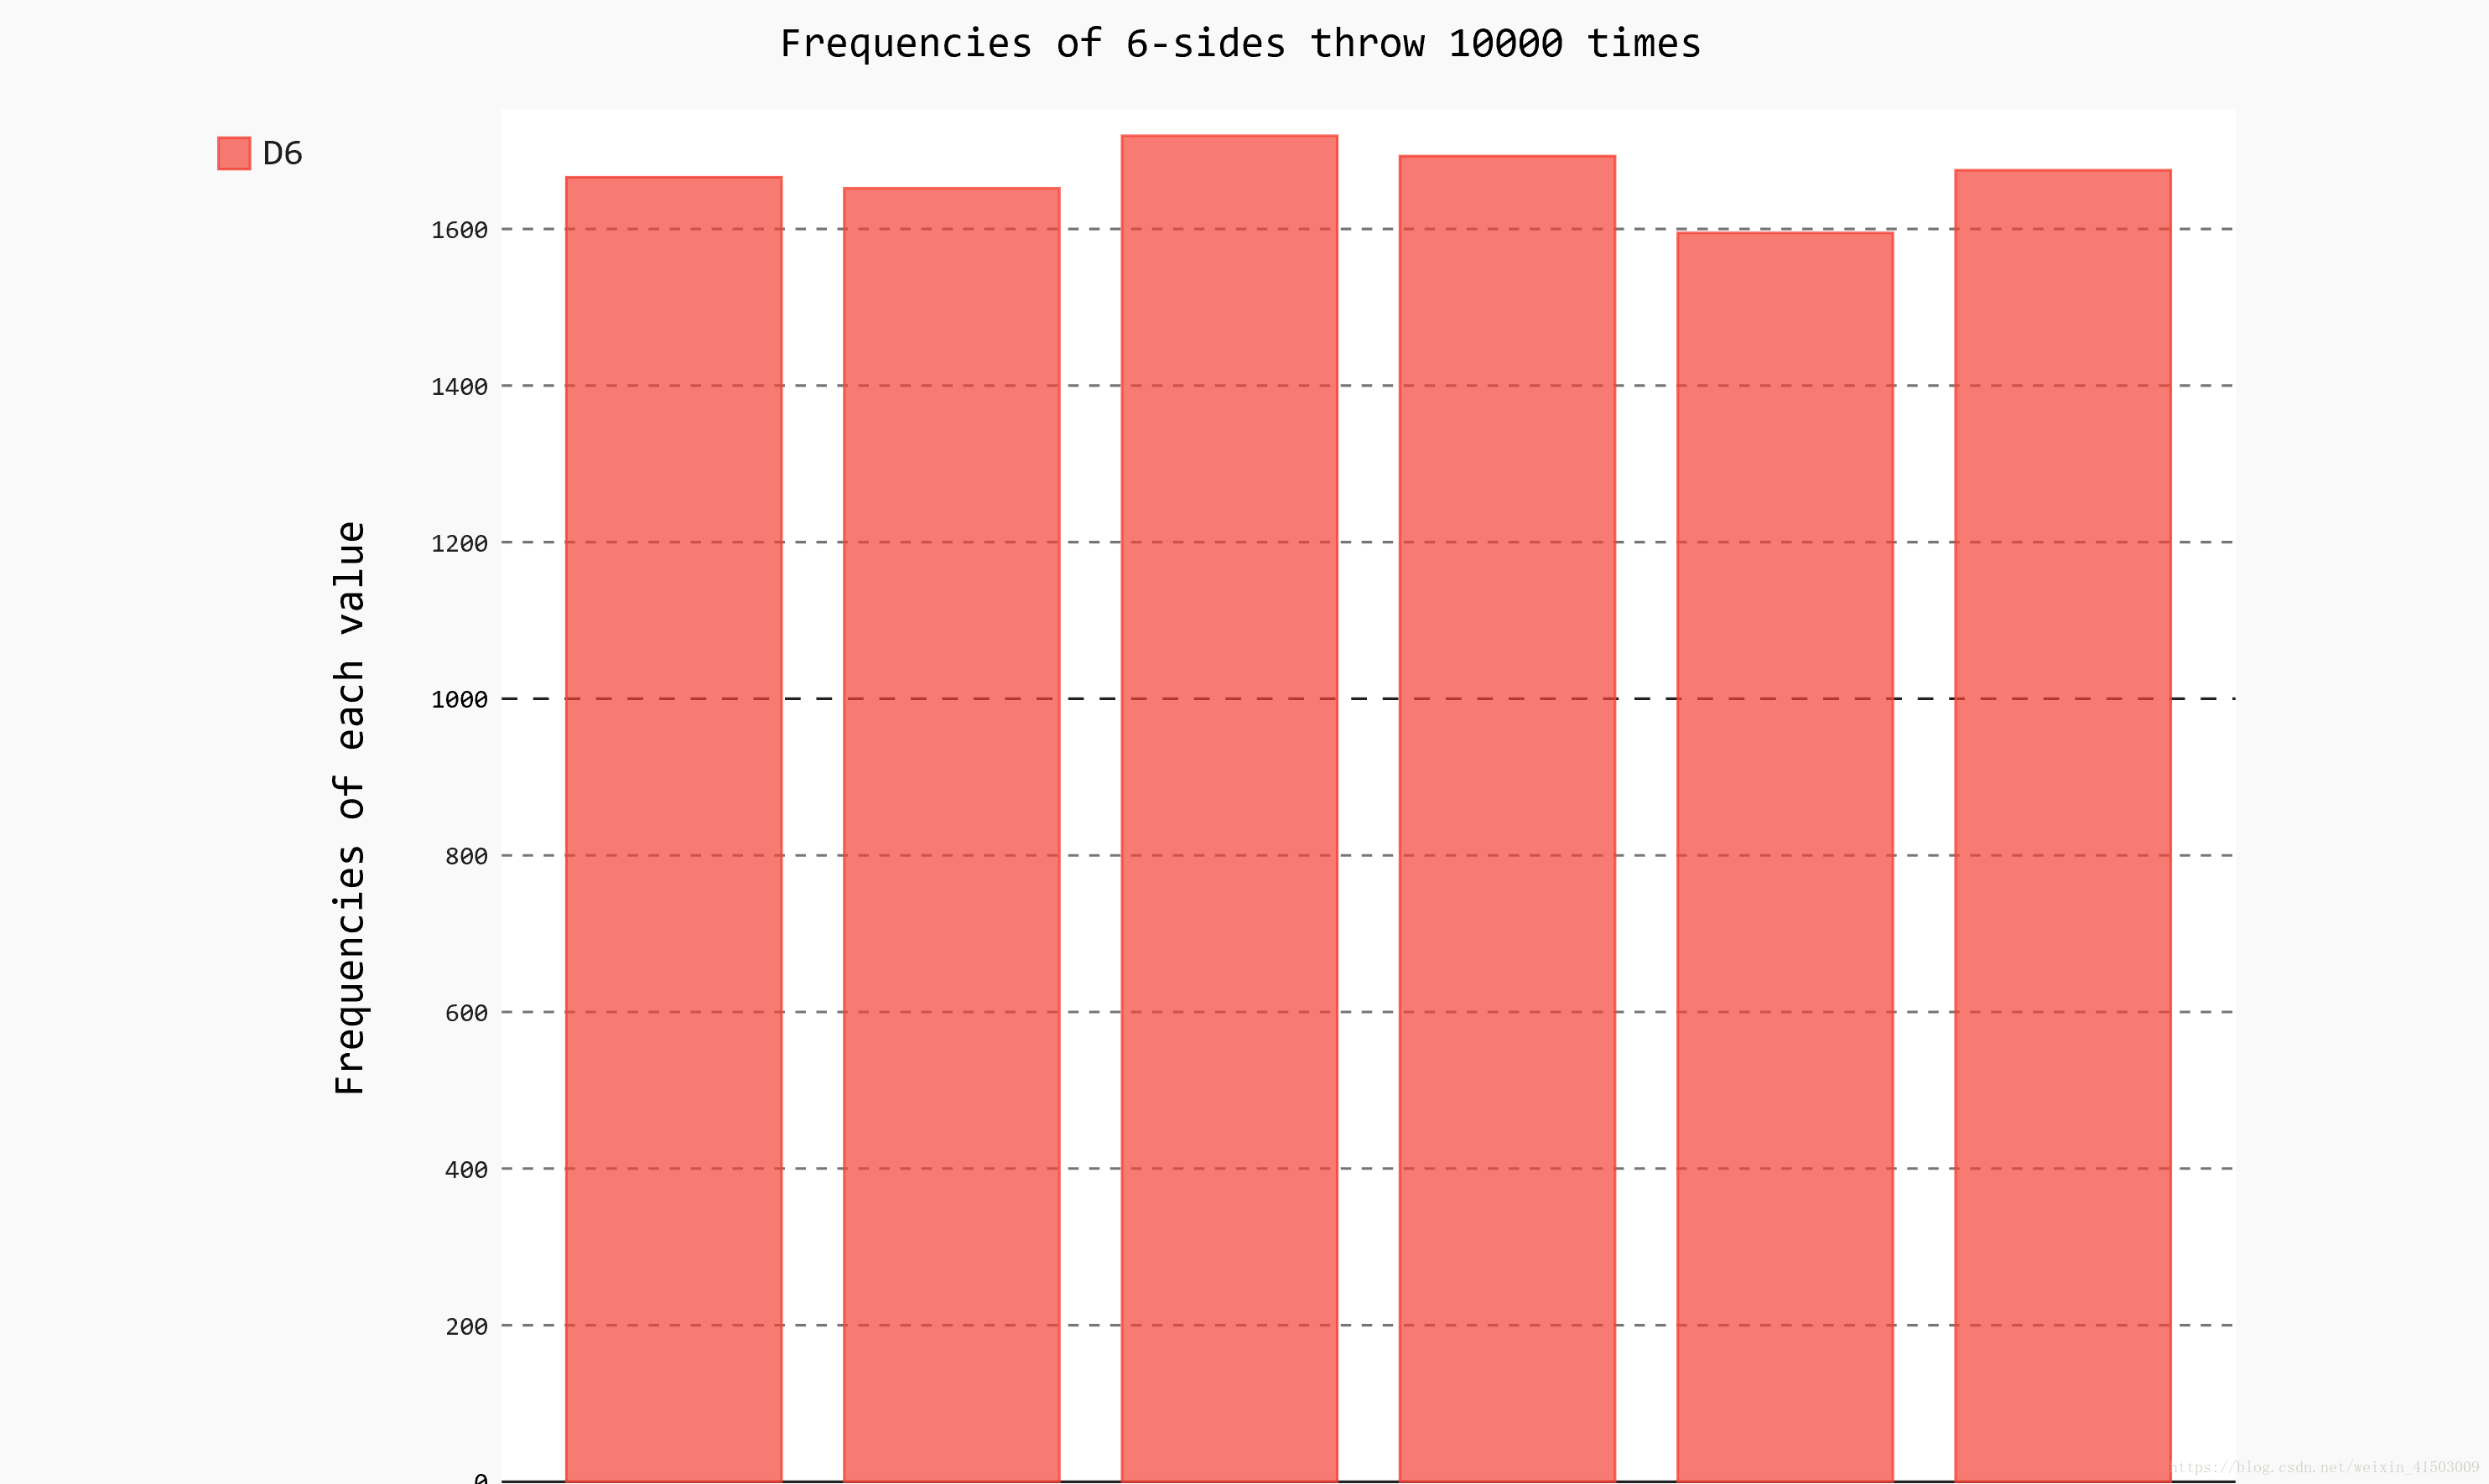
这便是一个6面骰子10000次投掷后的频数统计。
再来看下2个6面的骰子点数统计会是如何的呢?
import pygal
from die import Die
die1 = Die()
die2 = Die()
num_throw = 10000

results = [die1.roll() + die2.roll()
           for num in range(num_throw)]
frequencies = [results.count(value)
               for value in range
               (2, die1.num_sides+die2.num_sides+1)]
hist = pygal.Bar()
hist.title = 'Results of two D6 throw %d times' % num_throw
hist.x_labels = list(range(2, die1.num_sides+die2.num_sides+1))
hist.x_title = "Results"
hist.y_title = "Frequency of value"
hist.add('D6+D6', frequencies)
hist.render_to_file('D6_D6.svg')
hist.render_to_png('D6-D6_%d.png' % num_throw)
我们来看下结果:
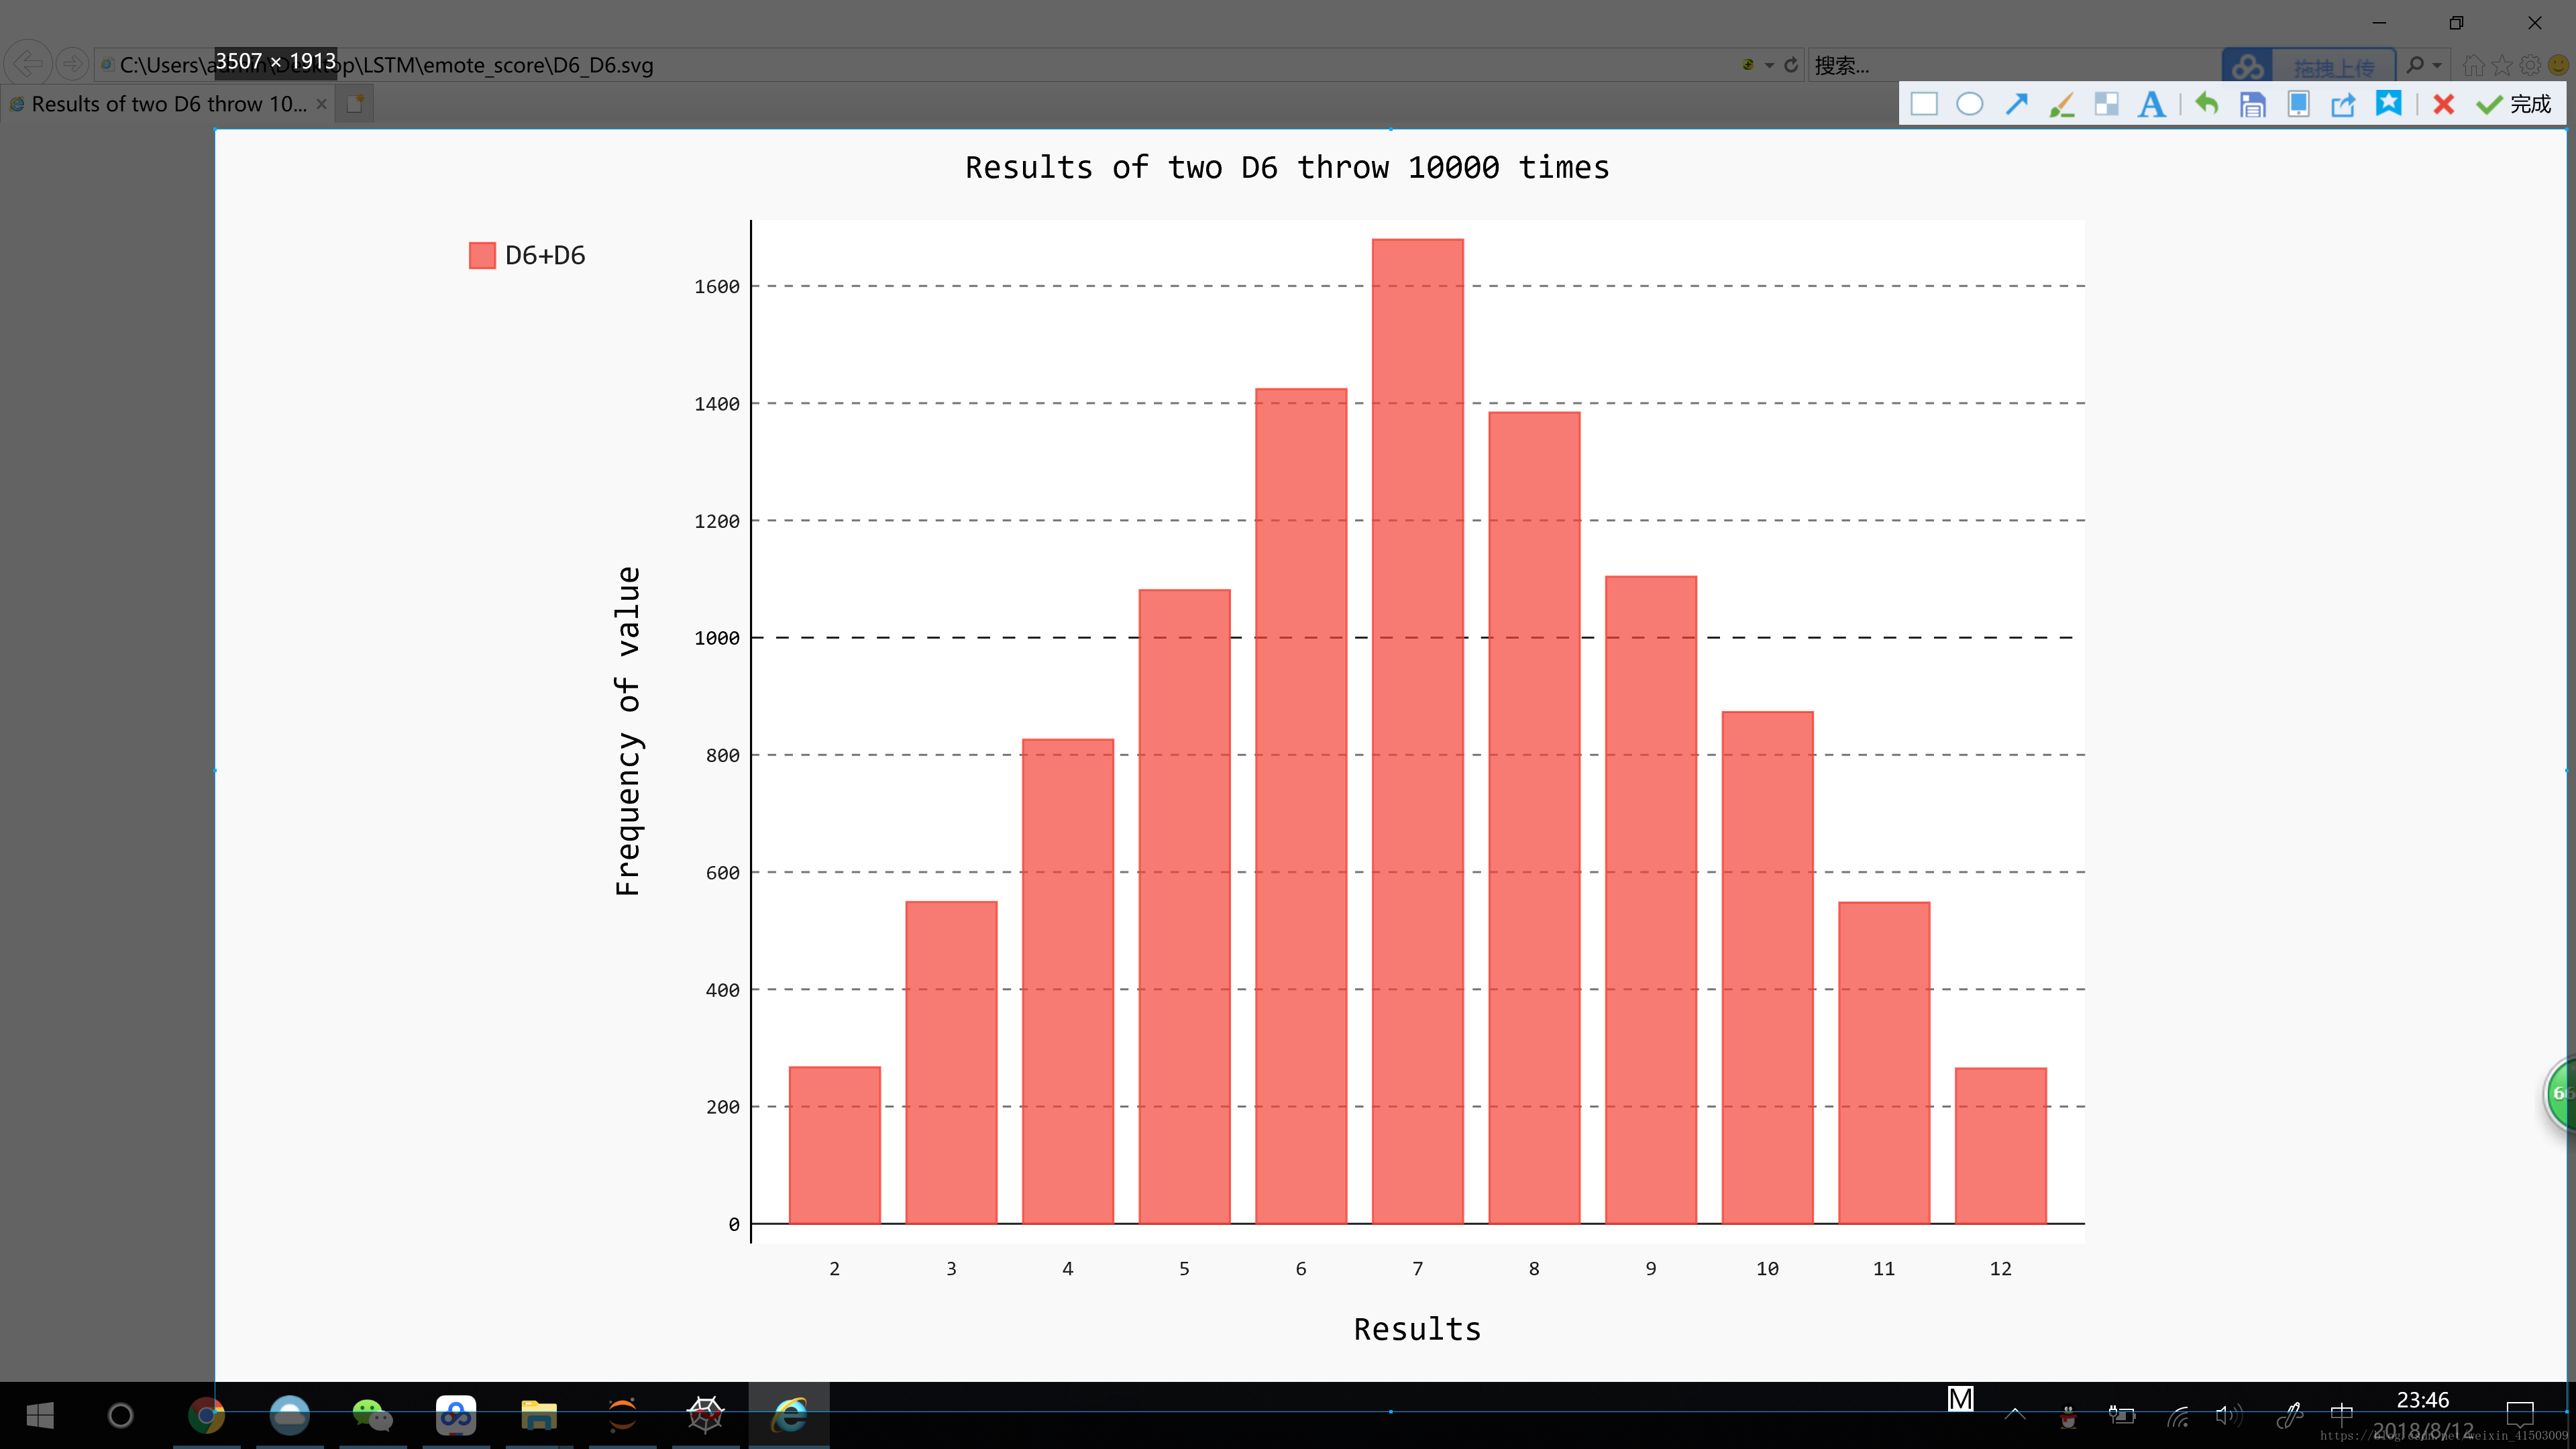
是不是标准的正态分布。
再来看下2个骰子投1000000次呢?我们只需要见num_throw = 1000000再运行程序就行了。看下结果:
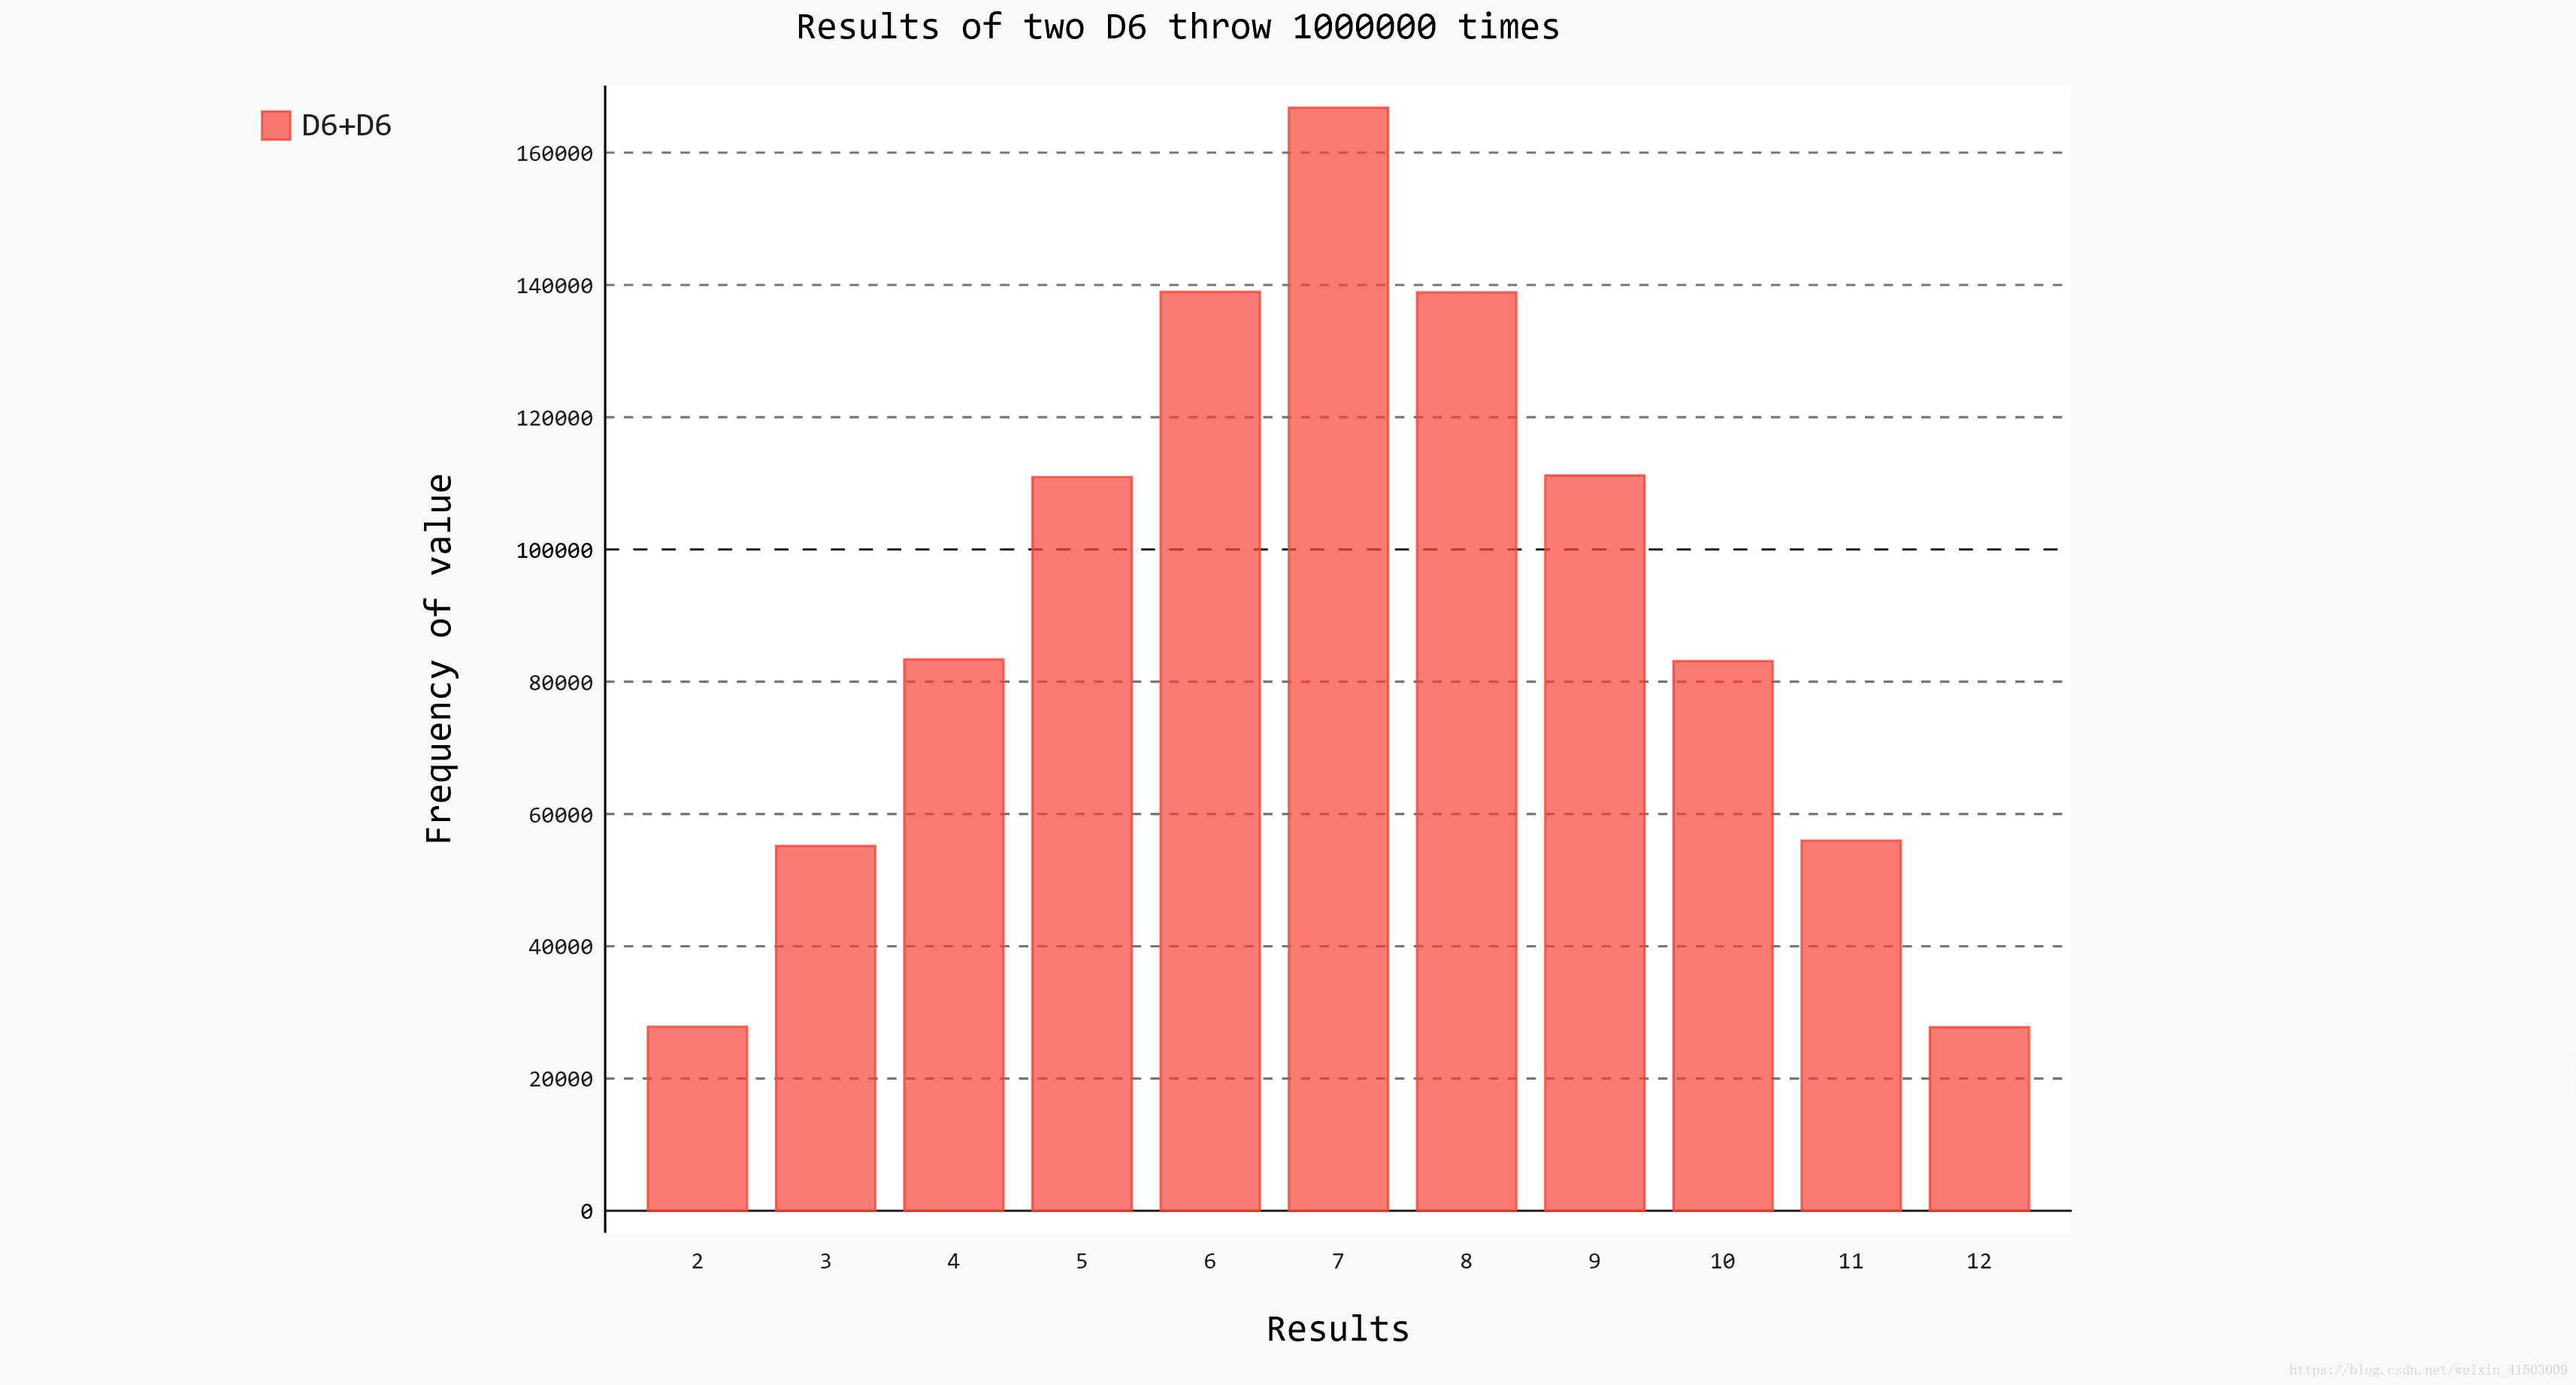
是不是跟接近正态分布?
这篇文章转载自:
作者:Kimmygogo
链接:https://www.jianshu.com/p/25f6309470d4