python 绘制拟合曲线并加指定点标识
import os
import numpy as np
from scipy import log
from scipy.optimize import curve_fit
import matplotlib.pyplot as plt
import math
from sklearn.metrics import r2_score
plt.rcParams['font.sans-serif']=['SimHei']
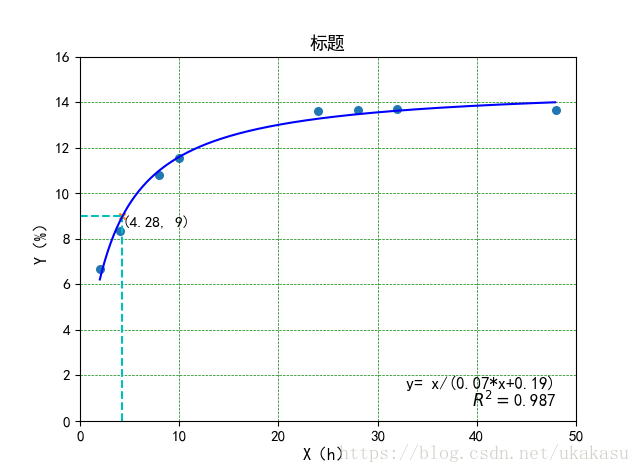
def func(x, a, b):
y = x/(a*x+b)
return y
x0 = [2, 4, 8, 10, 24, 28, 32, 48]
y0 = [6.66,8.35,10.81,11.55,13.63,13.68,13.69,13.67]
result = curve_fit(func, x0, y0,method='trf')
a, b = result[0]
x1 = np.arange(2, 48, 0.1)
y1 = x1/(a*x1+b)
x0 = np.array(x0)
y0 = np.array(y0)
y2 = x0/(a*x0+b)
r2 = r2_score(y0, y2)
plt.tick_params(labelsize=11)
plt.scatter(x0,y0,s=30,marker='o')
plt.xlim((0, 50))
plt.ylim((0, round(max(y0))+2))
plt.plot(x1, y1, "blue")
plt.title("标题",fontsize=13)
plt.xlabel('X(h)',fontsize=12)
plt.ylabel('Y(%)',fontsize=12)
p = round(9*b/(1-9*a),2)
p = round(p, 2)
plt.scatter(p,9,s=20,marker='x')
plt.vlines(p, 0, 9, colors = "c", linestyles = "dashed")
plt.hlines(9, 0, p, colors = "c", linestyles = "dashed")
plt.text(p, 9, (float('%.2f'% p),9),ha='left', va='top', fontsize=11)
m = round(max(y0)/10,1)
print(m)
plt.text(48, m, 'y= x/('+str(round(a,2))+'*x+'+str(round(b,2))+')', ha='right',fontsize=12)
plt.text(48, m, r'$R^2=$'+str(round(r2,3)), ha='right', va='top',fontsize=12)
plt.grid(True, linestyle = "--", color = "g", linewidth = "0.5")
plt.show()