版权声明:本文为博主原创文章,未经博主允许不得转载。 https://blog.csdn.net/zhuisaozhang1292/article/details/81634306
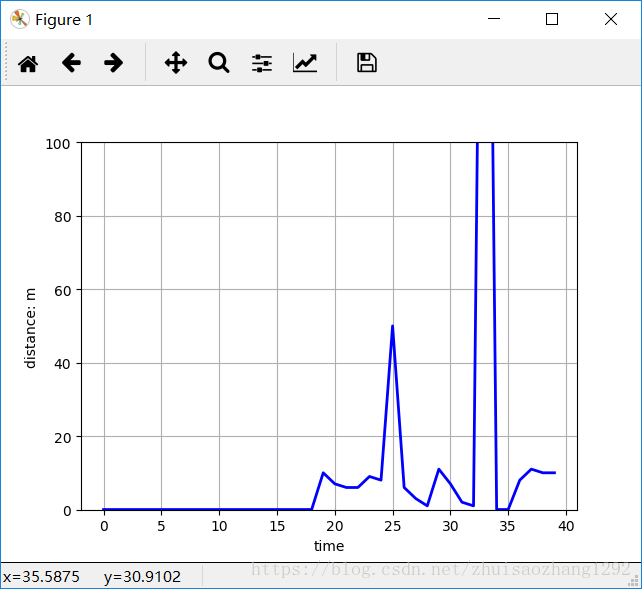
从txt种获取数据 并且通过动态曲线显示
import numpy as np
import matplotlib.pyplot as plt
import matplotlib.animation as animation
import time
# Fixing random state for reproducibility
np.random.seed(196)
path = "feed.txt"
file = open(path, 'r')
data = []
for line in file.readlines():
    lineArr = line.strip().split()
    data.append(int(lineArr[0]))
xdata = np.arange(0,len(data))
#初始数据绘图
dis = np.zeros(40)
dis2 = dis
fig, ax = plt.subplots()
line, = ax.plot(dis)
ax.set_ylim(0, 100)
plt.grid(True)
ax.set_ylabel("distance: m")
ax.set_xlabel("time")

def update(frame):
    global dis
    global dis2
    global line
    #读入模拟
    a = frame
    time.sleep(np.random.rand()/10)
    #绘图数据生成
    dis[0:-1] = dis2[1:]
    dis[-1] = a
    dis2 = dis
    #绘图
    line.set_ydata(dis)
    #颜色设置
    plt.setp(line, 'color', 'b', 'linewidth', 2.0)
    return line
ani = animation.FuncAnimation(fig, update,frames=data, interval=10)
plt.show()
输出: