在观察数据时,动态图像比静态图像更能反映出数据的趋势和特点。这篇文章记录了如何使用matplotlib进行动态图形绘制。
主要利用了animation类的api
1.matplotlib.animation
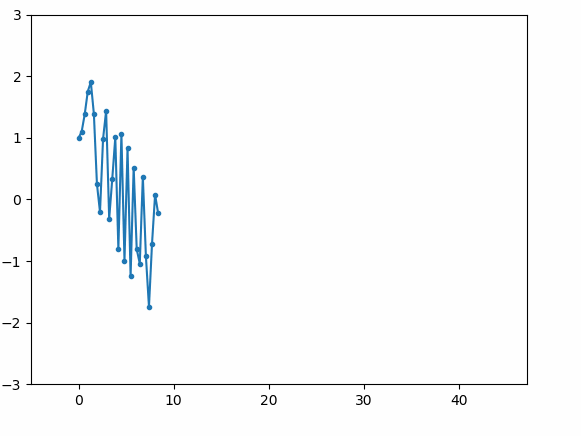
首先来画一条线,将一条线绘制的过程动态化:
import numpy as np
import matplotlib.pyplot as plt
from matplotlib.animation import FuncAnimation   #导入负责绘制动画的接口
#其中需要输入一个更新数据的函数来为fig提供新的绘图信息

fig, ax = plt.subplots()          #生成轴和fig,  可迭代的对象
x, y= [], []    #用于接受后更新的数据
line, = plt.plot([], [], '.-')   #绘制线对象,plot返回值类型,要加逗号

#------说明--------#
#核心函数包含两个:
#一个是用于初始化画布的函数init()
#另一个是用于更新数据做动态显示的update()


def init():
	#初始化函数用于绘制一块干净的画布,为后续绘图做准备
    ax.set_xlim(-5, 15*np.pi)    #初始函数,设置绘图范围
    ax.set_ylim(-3, 3)
    return line

def update(step):           #通过帧数来不断更新新的数值
    x.append(step)
    y.append(np.cos(step/3)+np.sin(step**2))    #计算y
    line.set_data(x, y)
    return line

#fig 是绘图的画布
#update 为更新绘图的函数,step数值是从frames 传入
#frames 数值是用于动画每一帧的数据
ani = FuncAnimation(fig, update, frames=np.linspace(0, 13*np.pi, 128),
                    init_func=init,interval=20)

plt.show()
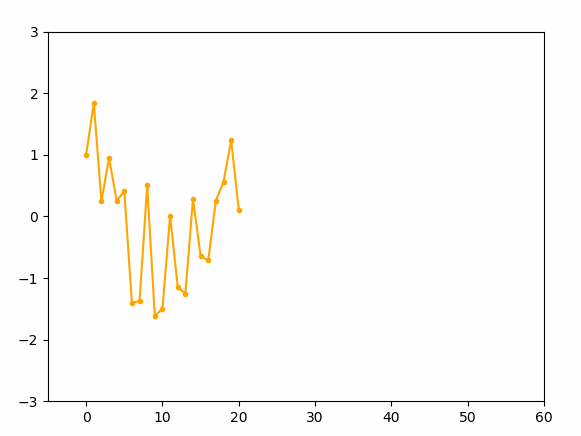
为了让程序在我们需要的帧数下停止而不是继续绘制,需要对上面的程序稍微修改,加入帧数限制:
fig, ax = plt.subplots()
x, y= [], []
line, = plt.plot([], [], '.-',color='orange')
nums = 50   #需要的帧数

def init():
    ax.set_xlim(-5, 60)
    ax.set_ylim(-3, 3)
    return line

def update(step):
    if len(x)>=nums:       #通过控制帧数来避免不断的绘图
        return line
    x.append(step)
    y.append(np.cos(step/3)+np.sin(step**2))    #计算y
    line.set_data(x, y)
    return line

ani = FuncAnimation(fig, update, frames=nums,     #nums输入到frames后会使用range(nums)得到一系列step输入到update中去
                    init_func=init,interval=20)
plt.show()
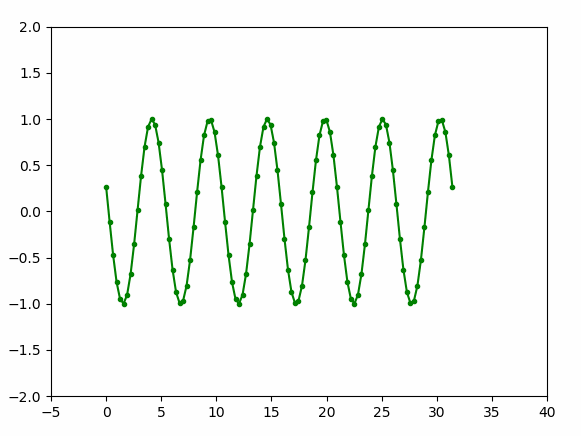
2.画一个行波
行波可以理解成相位不断编码的正余弦波,那么将上面的update函数修改一下:
fig, ax = plt.subplots()
x, y= [], []
line, = plt.plot([], [], '.-',color='green')
nums = 100   #需要的帧数

def init():
    ax.set_xlim(-5, 40)
    ax.set_ylim(-2, 2)
    return line

def update(step):
    x = np.linspace(0,10*np.pi,100)
    y = np.cos(1.2*x+step)  #这里只改变相位
    line.set_data(x, y) #设置新的 x,y
    return line

ani = FuncAnimation(fig, update, frames=nums,     #nums输入到frames后会使用range(nums)得到一系列step输入到update中去
                    init_func=init,interval=100)
plt.show()
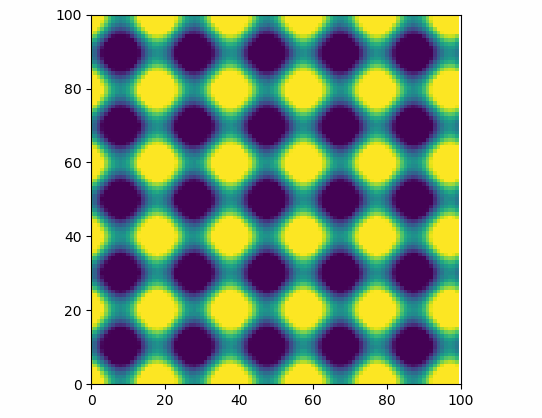
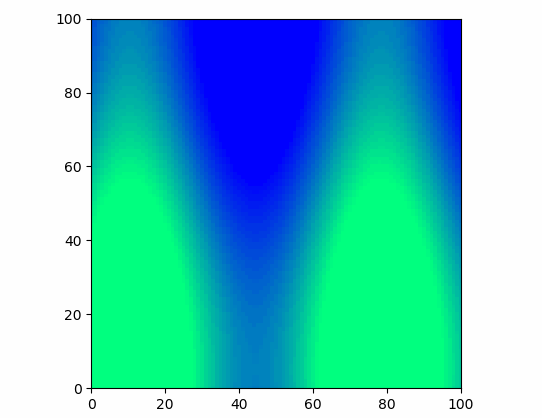
3.一个简单的小动画
我们接下来尝试一下二维的动画绘制,可以将刚才的行波变成二维的波浪来画:
fig, ax = plt.subplots()
x = np.linspace(-10*np.pi,10*np.pi,100)
y = np.linspace(-10*np.pi,10*np.pi,100)
X,Y = np.meshgrid(x,y)
img = plt.imshow(np.sin(X))
nums = 1000   #需要的帧数

def init():
    ax.set_xlim(0, 100)
    ax.set_ylim(0, 100)
    return img

def update(step):
    # z = np.cos((0.5*X*(np.cos(0.01*step)+0.1))+step)+np.sin(0.5*(Y*(np.sin(0.01*step)+0.1))+step)
    z = np.cos((0.5*X+np.cos(2*step))+step)+np.sin(0.5*(Y+np.sin(2*step))+step)
    img.set_data(z) #设置新的 x,y
    return img

ani = FuncAnimation(fig, update, frames=nums,     #nums输入到frames后会使用range(nums)得到一系列step输入到update中去
                    init_func=init,interval=40)
plt.show()
修改下参数来点更好玩的:
fig, ax = plt.subplots()
x = np.linspace(-10*np.pi,10*np.pi,300)
y = np.linspace(-10*np.pi,10*np.pi,300)
X,Y = np.meshgrid(x,y)
img = plt.imshow(np.sin(X),cmap='ocean')
nums = 1000   #需要的帧数

def init():
    ax.set_xlim(0, 100)
    ax.set_ylim(0, 100)
    return img

def update(step):
    z = np.cos((0.5*X*(np.cos(0.01*step)+0.1))+step)+np.sin(0.5*(Y*(np.sin(0.01*step)+0.1))+step)
    # z = np.cos((X*(np.cos(0.01*step)+0.2))+step)+np.sin((Y*(np.sin(0.01*step)+0.2))+step)
    img.set_data(z) #设置新的 x,y
    return img

ani = FuncAnimation(fig, update, frames=nums,     #nums输入到frames后会使用range(nums)得到一系列step输入到update中去
                    init_func=init,interval=40)
plt.show()
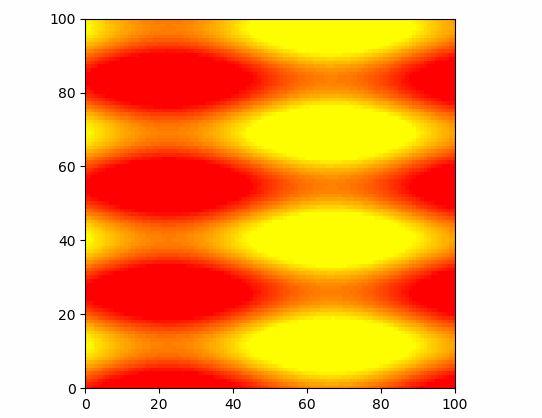
准备画波浪的,但好像看到极光了。。。
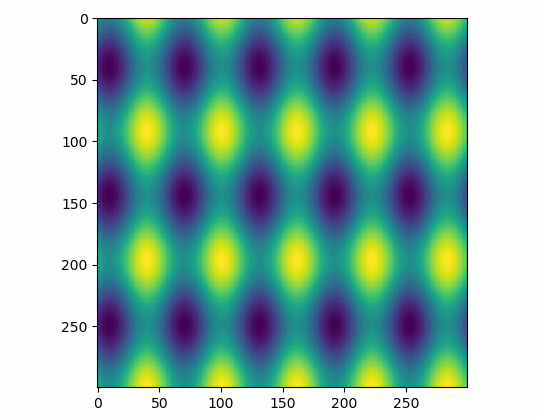
除了上面的方法,matplotlib中还提供了一种基于图像列表的方法还绘制动画:
这次使用的是animation中ArtistAnimation, 这个函数的区别在于在绘图前就需要将所有的绘制对象计算好存下来,相当于动态播放计算的绘图结果。上面的行波也可以按照这样的方式显示:
fig, ax = plt.subplots()
x = np.linspace(-10*np.pi,10*np.pi,300)
y = np.linspace(-10*np.pi,10*np.pi,300)
X,Y = np.meshgrid(x,y)
nums = 100   #需要的帧数,这里要注意不要爆内存,另外大一点有利于显示完全函数的变换周期
imgs = []   #用于存储所有的img

fig = plt.figure()   #只需要一个图,不需要iter了

def make_z(step):
	z = np.cos((0.5*X*(np.cos(0.01*step)+0.1))+step)+np.sin(0.5*(Y*(np.sin(0.01*step)+0.1))+step)
	return z

for step in range(nums):
    img = make_z(step)
    im = plt.imshow(img, animated=True)
    imgs.append([im])   #这里将多个图像对象叠加在一起,imgs为列表对象


ani = animation.ArtistAnimation(fig, imgs, interval=100, repeat_delay=100)
#设置每帧间隔iterval ms,以及播放完以后循环播放检测
plt.show()
TODO(rjj): another effects learning
ref:
https://matplotlib.org/api/animation_api.html?highlight=animation#module-matplotlib.animation
https://matplotlib.org/gallery/animation/dynamic_image.html
https://zhuanlan.zhihu.com/p/32444081
https://blog.csdn.net/liang890319/article/details/52067251
https://blog.csdn.net/liang890319/article/details/52062905
https://zhuanlan.zhihu.com/p/35818908
gif:https://blog.csdn.net/weixin_33895695/article/details/87990582
imagemagic:https://www.cnblogs.com/congtou5/p/5222769.html
picture from:https://www.easyicon.net/1225581-animal_character_psyduck_screech_yellow_icon.html