协方差与相关系数
这两个概念别弄混就好了,挺简单的,我也就不多说了。
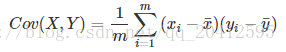
协方差:numpy.cov官网参数
从数值来看,协方差的数值越大,两个变量同向程度也就越大。反之亦然。

numpy.cov(m, y=None, rowvar=True, bias=False, ddof=None, fweights=None, aweights=None)[source]
Parameters: m : array_like
A 1-D or 2-D array containing multiple variables and observations. Each row of m represents a variable, and each column a single observation of all those variables. Also see rowvar below.
y : array_like, optional
An additional set of variables and observations. y has the same form as that of m.
rowvar : bool, optional
这个变量很重要,可以改变计算行还是计算列
If rowvar is True (default), then each row represents a variable, with observations in the columns. Otherwise, the relationship is transposed: each column represents a variable, while the rows contain observations.
bias : bool, optional
Default normalization (False) is by
(N - 1), whereNis the number of observations given (unbiased estimate). If bias is True, then normalization is byN. These values can be overridden by using the keywordddofin numpy versions >= 1.5.ddof : int, optional
If not
Nonethe default value implied by bias is overridden. Note thatddof=1will return the unbiased estimate, even if both fweights and aweights are specified, andddof=0will return the simple average. See the notes for the details. The default value isNone.New in version 1.5.
fweights : array_like, int, optional
1-D array of integer frequency weights; the number of times each observation vector should be repeated.
New in version 1.10.
aweights : array_like, optional
1-D array of observation vector weights. These relative weights are typically large for observations considered “important” and smaller for observations considered less “important”. If
ddof=0the array of weights can be used to assign probabilities to observation vectors.New in version 1.10.
import numpy as np

a = np.array([1,2,3])
b = np.array([4,3,4])
np.cov(a, b)

>>> np.cov(a, b)
array([[ 1.        ,  0.        ],
       [ 0.        ,  0.33333333]])
相关系数:numpy.corrcoef官网参数
相关系数是用以反映变量之间相关关系密切程度的统计指标。相关系数也可以看成协方差:一种剔除了两个变量量纲影响、标准化后的特殊协方差,它消除了两个变量变化幅度的影响,而只是单纯反应两个变量每单位变化时的相似程度。
相关系数的公式为:
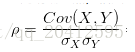
翻译一下:就是用X、Y的协方差除以X的标准差和Y的标准差。
所以,相关系数也可以看成协方差:一种剔除了两个变量量纲影响、标准化后的特殊协方差。
numpy.corrcoef(x, y=None, rowvar=True, bias=<no value>, ddof=<no value>)[source]
Parameters: x : array_like
A 1-D or 2-D array containing multiple variables and observations. Each row of x represents a variable, and each column a single observation of all those variables. Also see rowvar below.
y : array_like, optional
An additional set of variables and observations. y has the same shape as x.
rowvar : bool, optional
If rowvar is True (default), then each row represents a variable, with observations in the columns. Otherwise, the relationship is transposed: each column represents a variable, while the rows contain observations.
bias : _NoValue, optional
Has no effect, do not use.
Deprecated since version 1.10.0.
ddof : _NoValue, optional
Has no effect, do not use.
Deprecated since version 1.10.0.
import numpy as np

a = np.array([1,2,3])
b = np.array([2,5,8])

np.corrcoef(a, b)

>>> np.corrcoef(a, b)
array([[ 1.,  1.],
       [ 1.,  1.]])