import matplotlib.pyplot as plt
import numpy as np
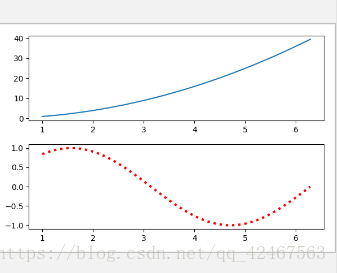
from matplotlib import font_managerX=np.linspace(1,2*np.pi,100)
plt.figure(figsize=(6,4))
Y_x2=X**2
plt.subplot(211)
plt.plot(X,Y_x2)
plt.subplot(212)
Y_sin=np.sin(X)
plt.plot(X,Y_sin,c='r',lw=3,ls=':')
#c='r'代表线的颜色,lw代表线的粗细,ls代表线的类型虚线
plt.show()