1. 开源软件比较(Zabbix、Nagios、Open-Falcon)
1.4 Zabbix、Nagios、Open-Falcon这3大开源运维监控工具的比较:
1. 开源软件比较(Zabbix、Nagios、Open-Falcon)
1.1 Zabbix
入门容易、上手简单、功能强大并且开源免费是云智慧对Zabbix的最直观评价。Zabbix易于管理和配置,能生成比较漂亮的数据图,其自动发 现功能大大减轻日常管理的工作量,丰富的数据采集方式和API接口可以让用户灵活进行数据采集,而分布式系统架构可以支持监控更多的设备。理论上,通过 Zabbix提供的插件式架构,可以满足企业的任何需求。
用户群:85%以上的泛互联网企业。
优点:
1. 支持多平台的企业级分布式开源监控软件
2. 安装部署简单,多种数据采集插件灵活集成
3. 功能强大,可实现复杂多条件告警,
4. 自带画图功能,得到的数据可以绘成图形
5. 提供多种API接口,支持调用脚本
6. 出现问题时可自动远程执行命令(需对agent设置执行权限)
缺点:
1. 项目批量修改不方便
2. 社区虽然成熟,但是中文资料相对较少,服务支持有限;
3. 入门容易,能实现基础的监控,但是深层次需求需要非常熟悉Zabbix并进行大量的二次定制开发,难度较大;
4. 系统级别报警设置相对比较多,如果不筛选的话报警邮件会很多;并且自定义的项目报警需要自己设置,过程比较繁琐;
5. 缺少数据汇总功能,如无法查看一组服务器平均值,需进行二次开发;
6. 数据报表需要特殊二次开发定义;
1.2 Nagios
Nagios是一款开源的企业级监控系统,能够实现对系统CPU、磁盘、网络等方面参数的基本系统监控,以及 SMTP,POP3,HTTP,NNTP等各种基本的服务类型。另外通过安装插件和编写监控脚本,用户可以实现应用监控,并针对大量的监控主机和多个对象 部署层次化监控架构。
Nagios最大的特点是其强大的管理中心,尽管其功能是监控服务和主机的,但Nagios自身并不包括这部分功能代码,所有的监控、告警功能都是由相关插件完成的。
用户群:适合复杂IT环境的企业
优点:
1. 出错的服务器、应用和设备会自动重启,自动日志滚动
2. 配置灵活,可以自定义shell脚本,通过分布式监控模式
3. 支持以冗余方式进行主机监控,报警设置多样
4. 命令重新加载配置文件无需打扰Nagios的运行
缺点:
1. 事件控制台功能很弱,插件易用性差
2. 对性能、流量等指标的处理不给力
3. 看不到历史数据,只能看到报警事件,很难追查故障原因
4. 配置复杂,初学者投入的时间、精力和成本比较大
1.3 Open-Falcon
Open-falcon是小米运维团队从互联网公司的需求出发,根据多年的运维经验,结合SRE、SA、DEVS的使用经验和反馈,开发的一套面向互联网的企业级开源监控产品。
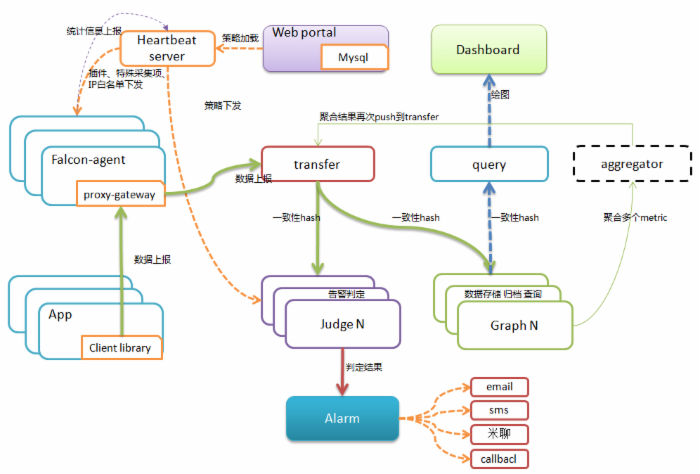
Open-falcon架构
用户群:目前有几十家企业用户不同程度使用。
优点:
1. 自动发现,支持falcon-agent、snmp、支持用户主动push、用户自定义插件支持
2. 支持每个周期上亿次的数据采集、告警判定、历史数据存储和查询
3. 高效的portal、支持策略模板、模板继承和覆盖、多种告警方式、支持callback调用
4. 单机支撑200万metric的上报、归档、存储
5. 采用rrdtool的数据归档策略,秒级返回上百个metric一年的历史数据
6. 多维度的数据展示,用户自定义Screen
7. 通过各种插件目前支持Linux、Windows、Mysql、Redis、Memache、RabbitMQ和交换机监控。
缺点:由于发布时间较短,很多基础的服务监控插件(如Tomcat、apache等)还不支持,很多功能还在不断完善中,另外由于缺少专门的支持,虽然有开放社区,但是解决问题的效率相对较低。
1.4 Zabbix、Nagios、Open-Falcon这3大开源运维监控工具的比较:

2.prometheus
3.1 Prometheus 是由 SoundCloud 开发的开源监控报警系统和时序列数据库(TSDB),它按给定的时间间隔从配置的目标收集指标,评估规则表达式,显示结果,并且如果观察到某些条件为真,则可触发警报。自2012年起,许多公司及组织已经采用 Prometheus,并且该项目有着非常活跃的开发者和用户社区.现在已经成为一个独立的开源项目核,并且保持独立于任何公司,Prometheus 在2016加入 CNCF ( Cloud Native Computing Foundation ), 作为在 kubernetes 之后的第二个由基金会主持的项目.
2.1 Prometheus的主要特点:
Prometheus 属于一站式监控告警平台,依赖少,功能齐全。
Prometheus 支持对云的或容器的监控,其他系统主要对主机监控。
Prometheus 数据查询语句表现力更强大,内置更强大的统计函数。
Prometheus 在数据存储扩展性以及持久性上没有 InfluxDB,OpenTSDB,Sensu 好。
2.2 Prometheus的核心组件
Prometheus Server, 主要用于抓取数据和存储时序数据,另外还提供查询和 Alert Rule 配置管理。
client libraries,用于对接 Prometheus Server, 可以查询和上报数据。
push gateway ,用于批量,短期的监控数据的汇总节点,主要用于业务数据汇报等。
各种汇报数据的 exporters ,例如汇报机器数据的 node_exporter, 汇报 MongoDB 信息的 MongoDB exporter 等等。
用于告警通知管理的 alertmanager 。
2.3 Prometheus的架构图

从这个架构图,也可以看出 Prometheus 的主要模块包含, Server, Exporters, Pushgateway, PromQL, Alertmanager, WebUI 等。
它大致使用逻辑是这样:
Prometheus server 定期从静态配置的 targets 或者服务发现的 targets 拉取数据。
当新拉取的数据大于配置内存缓存区的时候,Prometheus 会将数据持久化到磁盘(如果使用 remote storage 将持久化到云端)。
Prometheus 可以配置 rules,然后定时查询数据,当条件触发的时候,会将 alert 推送到配置的 Alertmanager。
Alertmanager 收到警告的时候,可以根据配置,聚合,去重,降噪,最后发送警告。
可以使用 API, Prometheus Console 或者 Grafana 查询和聚合数据。
3. zabbix配置文件详解
# This is a configuration file for Zabbix Server process

# To get more information about Zabbix,
# visit http://www.zabbix.com
############ GENERAL PARAMETERS #################
### Option: NodeID
#   Unique NodeID in distributed setup.
#   0 - standalone server
#
# Mandatory: no
# Range: 0-999
# Default:
#说明:服务端节点Id,0表示只有一台服务端;主要用于服务端分布式部署时,视使用者设计ZABBIX系统架构调整

# NodeID=0
### Option: ListenPort
#   Listen port for trapper.
#
# Mandatory: no
# Range: 1024-32767
# Default:
#说明:服务端监听端口用于接收二级代理或直连AGENT的采集数据


# ListenPort=10051

### Option: SourceIP
#   Source IP address for outgoing connections.
#
# Mandatory: no
# Default:
#说明:服务端监听IP,建议指定

# SourceIP=
### Option: LogFile
#   Name of log file.
#   If not set, syslog is used.
#
# Mandatory: no
# Default:
# LogFile=
#说明:zabbix服务端日志路径,视具体情况指定

LogFile=/smp/sncmon/zabbix_server.log
### Option: LogFileSize
#   Maximum size of log file in MB.
#   0 - disable automatic log rotation.
#
# Mandatory: no
# Range: 0-1024
# Default:
#说明:日志达到多少M里就轮转;若此参数值为0时,则不轮转,日志将不断变大,建议设置成轮转

# LogFileSize=1
### Option: DebugLevel
#   Specifies debug level
#   0 - no debug 无日志
#   1 - critical information  灾难日志,日志量较少
#   2 - error information  错误级别,日志量大于CRITICAL级别
#   3 - warnings    告警级别,日志量大于ERROR级别
#   4 - for debugging (produces lots of information)调试级别,日志量大于WARNING
#

# Mandatory: no
# Range: 0-4
# Default:
#说明:日志级别0~4,单位时间内生成日志的量不断增大

# DebugLevel=3
### Option: PidFile
#   Name of PID file.
#
# Mandatory: no
# Default:
#说明:zabbix服务端程序PID路径

# PidFile=/tmp/zabbix_server.pid
### Option: DBHost
#   Database host name.
#   If set to localhost, socket is used for MySQL.
#   If set to empty string, socket is used for PostgreSQL.
#
# Mandatory: no
# Default:
#说明:指定数据库信息,对于mysql,若设置为localhost则mysql用SOCKET来连接(需配合参数 DBSocket 使用),否则用IP连接;若DHHOST值为空,则默认连接PostgreSQL

# DBHost=localhost
### Option: DBName
#   Database name.
#   For SQLite3 path to database file must be provided. DBUser and DBPassword are ignored.
#
# Mandatory: yes
# Default:
# DBName=
#说明:服务端连接数据库的库名

DBName=smp
### Option: DBSchema
#   Schema name. Used for IBM DB2.
#
# Mandatory: no
# Default:
#说明:专门用于 IBM DB2数据库的连接信息

# DBSchema=
### Option: DBUser
#   Database user. Ignored for SQLite.
#
# Mandatory: no
# Default:
#说明:连接数据库的用户

# DBUser=
DBUser=root
### Option: DBPassword
#   Database password. Ignored for SQLite.
#   Comment this line if no password is used.
#
# Mandatory: no
# Default:
#说明:连接数据库的密码

DBPassword=123
### Option: DBSocket
#   Path to MySQL socket.
#
# Mandatory: no
# Default:
#说明:指定MYSQL的SOCK连接路径

# DBSocket=/tmp/mysql.sock
### Option: DBPort
#   Database port when not using local socket. Ignored for SQLite.
#
# Mandatory: no
# Range: 1024-65535
# Default (for MySQL):
#说明:指定连接数据库的端口

DBPort=3306
############ ADVANCED PARAMETERS ################
#高级参数
### Option: StartPollers
#   Number of pre-forked instances of pollers.
#
# Mandatory: no
# Range: 0-1000
# Default:
#说明;初始化时,启动子进程数量,数量越多,则服务端吞吐能力越强,对系统资源消耗越大
# StartPollers=5
### Option: StartIPMIPollers
#   Number of pre-forked instances of IPMI pollers.
#
# Mandatory: no
# Range: 0-1000
# Default:
#
#说明:主要用于IPmi技术用于获取硬件状态场景。若无相关监控项,建议设置为0
# StartIPMIPollers=0
### Option: StartPollersUnreachable
#   Number of pre-forked instances of pollers for unreachable hosts (including IPMI).
#
# Mandatory: no
# Range: 0-1000
# Default:
#说明:默认情况下,ZABBIX会启用指定进程用于探测某些不可达主机的(含IPMI场景);若使用场景中含有代理端,建议保持默认;若直接agent较多,可视具体情况调整
# StartPollersUnreachable=1
### Option: StartTrappers
#   Number of pre-forked instances of trappers.
#   Trappers accept incoming connections from Zabbix sender, active agents, active proxies and child nodes.
#   At least one trapper process must be running to display server availability in the frontend.
#
# Mandatory: no
# Range: 0-1000
# Default:
说明:用于设置诸如SNMP STRAPPER场景提交来的数据的接收进程数,若客户机SNMP TRAPPER技术较多,建议加大此参数值
# StartTrappers=5
### Option: StartPingers
#   Number of pre-forked instances of ICMP pingers.
#
# Mandatory: no
# Range: 0-1000
# Default:
#说明:用于设置启用icmp协议PING主机方式启动线程数量,若单台代理所管理机器超过500台,建议加大此数值
# StartPingers=1
### Option: StartDiscoverers
#   Number of pre-forked instances of discoverers.
#
# Mandatory: no
# Range: 0-250
# Default:
说明:用于设置自动发现主机的线程数量,若单台代理所管理机器超过500台,可以考虑加大此数值(仅适用于直接AGENT场景)
# StartDiscoverers=1
### Option: StartHTTPPollers
#   Number of pre-forked instances of HTTP pollers.
#
# Mandatory: no
# Range: 0-1000
# Default:
#说明:用于设置WEB拨测监控线程数,可视具体情况增加或减少此数值。
# StartHTTPPollers=1
### Option: StartTimers
#   Number of pre-forked instances of timers.
#   Timers process time-based trigger functions and maintenance periods.
#   Only the first timer process handles the maintenance periods.
#
# Mandatory: no
# Range: 1-1000
# Default:
#说明:各实例计时器数量,主要用于触发器,标有维护标识的主机,但只第一个计时器用于计算维护标识主机。
# StartTimers=1
### Option: JavaGateway
#   IP address (or hostname) of Zabbix Java gateway.
#   Only required if Java pollers are started.
#
# Mandatory: no
# Default:
#说明:JAVAGATEWAY 场景下使用
# JavaGateway=
### Option: JavaGatewayPort
#   Port that Zabbix Java gateway listens on.
#
# Mandatory: no
# Range: 1024-32767
# Default:
#说明:JAVAGATEWAY 场景下使用
# JavaGatewayPort=10052
### Option: StartJavaPollers
#   Number of pre-forked instances of Java pollers.
#
# Mandatory: no
# Range: 0-1000
# Default:
#说明:JAVAGATEWAY 场景下使用
# StartJavaPollers=0
### Option: StartVMwareCollectors
#   Number of pre-forked vmware collector instances.
#
# Mandatory: no
# Range: 0-250
# Default:
#说明:用于设置监控VMWARE Esxi主机实例时使用,若为0则不启用,若要监控ESXI主机,此值最少为1 ;视监控ESXI数量设置对应数值
# StartVMwareCollectors=0
### Option: VMwareFrequency
#   How often Zabbix will connect to VMware service to obtain a new data.
#
# Mandatory: no
# Range: 10-86400
# Default:
#说明:代理端访问 VMWARE service的频率,单位:秒
# VMwareFrequency=60
### Option: VMwareCacheSize
#   Size of VMware cache, in bytes.
#   Shared memory size for storing VMware data.
#   Only used if VMware collectors are started.
#
# Mandatory: no
# Range: 256K-2G
# Default:
#说明:划出多少共享内存用于存储VMWARE数据
# VMwareCacheSize=8M
### Option: SNMPTrapperFile
#   Temporary file used for passing data from SNMP trap daemon to the server.
#   Must be the same as in zabbix_trap_receiver.pl or SNMPTT configuration file.
#
# Mandatory: no
# Default:
#说明:指定SNMP TRAPPER 时的临时文件,用于代理端启用SNMP TRAPPER功能时使用
# SNMPTrapperFile=/tmp/zabbix_traps.tmp
### Option: StartSNMPTrapper
#   If 1, SNMP trapper process is started.
#
# Mandatory: no
# Range: 0-1
# Default:
#说明:是否启用 snmptrapper功能 ,默认不启用=0,启用=1(配合参数SNMPTrapperFile使用)
# StartSNMPTrapper=0
### Option: ListenIP
#   List of comma delimited IP addresses that the trapper should listen on.
#   Trapper will listen on all network interfaces if this parameter is missing.
#
# Mandatory: no
# Default:
说明:启用SNMPTRAPPER里 ,接收端监听的IP,此参数与StartSNMPTrapper,SNMPTrapperFile 联合使用
# ListenIP=0.0.0.0
# ListenIP=127.0.0.1
### Option: HousekeepingFrequency
#   How often Zabbix will perform housekeeping procedure (in hours).
#   Housekeeping is removing unnecessary information from history, alert, and alarms tables.
#
# Mandatory: no
# Range: 1-24
# Default:
#说明:多少小时清理一次代理端数据库的 history, alert, and alarms,以保持代理端数据库轻便,建议保持默认
# HousekeepingFrequency=1
### Option: MaxHousekeeperDelete
#   The table "housekeeper" contains "tasks" for housekeeping procedure in the format:
#   [housekeeperid], [tablename], [field], [value].
#   No more than 'MaxHousekeeperDelete' rows (corresponding to [tablename], [field], [value])
#   will be deleted per one task in one housekeeping cycle.
#   SQLite3 does not use this parameter, deletes all corresponding rows without a limit.
#   If set to 0 then no limit is used at all. In this case you must know what you are doing!
#
# Mandatory: no
# Range: 0-1000000
# Default:
# MaxHousekeeperDelete=500
### Option: SenderFrequency
#   How often Zabbix will try to send unsent alerts (in seconds).
#
# Mandatory: no
# Range: 5-3600
# Default:
#说明:多少秒后重试发送失败的报警信息
# SenderFrequency=30
### Option: CacheSize
#   Size of configuration cache, in bytes.
#   Shared memory size for storing host, item and trigger data.
#
# Mandatory: no
# Range: 128K-2G
# Default:
#说明;zabbix初始化时占用多少系统共享内存用于存储配置信息,HOST,ITEM,TRIGGER数据,视监控主机数量和监控项调整,建议调整到32M或者更大
# CacheSize=8M
### Option: CacheUpdateFrequency
#   How often Zabbix will perform update of configuration cache, in seconds.
#
# Mandatory: no
# Range: 1-3600
# Default:
#说明:zabbix更新操作系统CACHE频率,若管理页面操作不频繁,可以考虑加大参数值
# CacheUpdateFrequency=60
### Option: StartDBSyncers
#   Number of pre-forked instances of DB Syncers
#
# Mandatory: no
# Range: 1-100
# Default:
#说明:将采集数据从CACHE同步到数据库线程数量,视数据库服务器I/O繁忙情况,和数据库写能力调整。数值越大,写能力越强。对数据库服务器I/O压力越大。
# StartDBSyncers=4
### Option: HistoryCacheSize
#   Size of history cache, in bytes.
#   Shared memory size for storing history data.
#
# Mandatory: no
# Range: 128K-2G
# Default:
#说明:用于设置划分多少系统共享内存用于存储采集的历史数据,此数值越大,数据库读压力越小
# HistoryCacheSize=8M
### Option: TrendCacheSize
#   Size of trend cache, in bytes.
#   Shared memory size for storing trends data.
#
# Mandatory: no
# Range: 128K-2G
# Default:
#说明:用于设置划分多少系统共享内存用于存储计算出来的趋势数据,此参数值从一定程度上可影响数据库读压力
# TrendCacheSize=4M
### Option: HistoryTextCacheSize
#   Size of text history cache, in bytes.
#   Shared memory size for storing character, text or log history data.
#
# Mandatory: no
# Range: 128K-2G
# Default:
#说明:指定划出多少系统共享内存用于存储 character, text or log history数据,若二级代理内存足够,建议可适当扩大此数值,可很大程度上解决系统I/O压力,和数据库读压力
# HistoryTextCacheSize=16M
### Option: ValueCacheSize
#   Size of history value cache, in bytes.
#   Shared memory size for caching item history data requests
#   Setting to 0 disables value cache.
#
# Mandatory: no
# Range: 0,128K-64G
# Default:
#说明:划出系统多少共享内存用于已请求的存储监控项信息,若监控项较多,建议加大此数值
# ValueCacheSize=8M
### Option: NodeNoEvents
#   If set to '1' local events won't be sent to master node.
#   This won't impact ability of this node to propagate events from its child nodes.
#
# Mandatory: no
# Range: 0-1
# Default:
#说明:若节点为子结点,是否允许本地事件(events表)发送到主节点,1为不发送,但不影响此节点以下的节点的传播能力,视ZABBIX分布式系统架构设计开启或关闭。在不明架构前提下,建议保持默认
# NodeNoEvents=0
### Option: NodeNoHistory
#   If set to '1' local history won't be sent to master node.
#   This won't impact ability of this node to propagate history from its child nodes.
#
# Mandatory: no
# Range: 0-1
# Default:
说明:若节点为子结点,是否允许本地历史数据发送到主节点,1为不发送,但不影响此节点以下的节点的传播能力,视ZABBIX分布式系统架构设计开启或关闭,在不明架构前提下,建议保持默认
# NodeNoHistory=0
### Option: Timeout
#   Specifies how long we wait for agent, SNMP device or external check (in seconds).
#
# Mandatory: no
# Range: 1-30
# Default:
#说明:与AGNET\SNMP设备和其它外部设备通信超时设置,单位为秒;若采集数据不完整或网络繁忙,或从管理页面发现客户端状态变化频繁,可以考虑加大此数值。注意若此数值加大,应该考虑参数 StartPollers 是否有相应加大的必要。
# Timeout=3
### Option: TrapperTimeout
#   Specifies how many seconds trapper may spend processing new data.
#
# Mandatory: no
# Range: 1-300
# Default:
#说明:启用 trapper功能,用于进程等待超时设置。根据需要调整
# TrapperTimeout=300
### Option: UnreachablePeriod
#   After how many seconds of unreachability treat a host as unavailable.
#
# Mandatory: no
# Range: 1-3600
# Default:
#说明:当AGNET端处于不可用状态下,间隔多少秒后,尝试重新连接。建议根据具体情况设置。注意,若此数值过小,右agent端业务系统繁忙时,有可能造成报警信息误报
# UnreachablePeriod=45
### Option: UnavailableDelay
#   How often host is checked for availability during the unavailability period, in seconds.
#
# Mandatory: no
# Range: 1-3600
# Default:
#说明:当AGENT端处于可用状态下,间隔多少秒后,进行状态检查。若出现可正常采集数据,但管理页面AGENT状态不正常;若在网络,端口等均通畅情况下,AGENT状态仍不正常,可以考虑加大此数值
# UnavailableDelay=60
### Option: UnreachableDelay
#   How often host is checked for availability during the unreachability period, in seconds.
#
# Mandatory: no
# Range: 1-3600
# Default:
#说明:当agent端处于不可达状态下,延迟多少秒后,进行重新尝试,建议保持默认,在AGENT接入调试阶段,可考虑减少此数值
# UnreachableDelay=15
### Option: AlertScriptsPath
#   Full path to location of custom alert scripts.
#   Default depends on compilation options.
#
# Mandatory: no
# Default:
#说明:监控报警脚本路径,非研发人员不建议修改此参数值
# AlertScriptsPath=${datadir}/zabbix/alertscripts
### Option: ExternalScripts
#   Full path to location of external scripts.
#   Default depends on compilation options.
#
# Mandatory: no
# Default:
#说明:自定义脚本存储路径,非研发人员不建议修改此参数值
# ExternalScripts=${datadir}/zabbix/externalscripts
### Option: FpingLocation
#   Location of fping.
#   Make sure that fping binary has root ownership and SUID flag set.
#
# Mandatory: no
# Default:
#说明:IPv4 FPING命令路径,仅ROOT可用。注意使用此命令时,应该确认此命令是否存在
# FpingLocation=/usr/sbin/fping
### Option: Fping6Location
#   Location of fping6.
#   Make sure that fping6 binary has root ownership and SUID flag set.
#   Make empty if your fping utility is capable to process IPv6 addresses.
#
# Mandatory: no
# Default:
#说明:IPv6 FPING命令路径,仅ROOT可用。注意使用此命令时,应该确认此命令是否存在
# Fping6Location=/usr/sbin/fping6
### Option: SSHKeyLocation
#   Location of public and private keys for SSH checks and actions.
#
# Mandatory: no
# Default:
#说明:在服务端需要SSH到AGENT端且采用用KEY验证方式时使用。非研发人员,不建议修改或设置
# SSHKeyLocation=
### Option: LogSlowQueries
#   How long a database query may take before being logged (in milliseconds).
#   Only works if DebugLevel set to 3 or 4.
#   0 - don't log slow queries.
#
# Mandatory: no
# Range: 1-3600000
# Default:
#说明:用于服务端数据库慢查询功能,单位是毫秒;1毫秒=0.001秒,若有服务端数据库监控慢查询的需求,可以视具体情况调整此数。
# LogSlowQueries=0
### Option: TmpDir
#   Temporary directory.
#
# Mandatory: no
# Default:
#说明:zabbix服务端工作的临时目录
# TmpDir=/tmp
### Option: StartProxyPollers
#   Number of pre-forked instances of pollers for passive proxies.
#
# Mandatory: no
# Range: 0-250
# Default:
#说明:启用多少子进程与代理端通信,若代理端较多可考虑加大此数值
# StartProxyPollers=1
### Option: ProxyConfigFrequency
#   How often Zabbix Server sends configuration data to a Zabbix Proxy in seconds.
#   This parameter is used only for proxies in the passive mode.
#
# Mandatory: no
# Range: 1-3600*24*7
# Default:
#说明:zabbix服务端将配置文件数据同步到代理端的频率,仅适用于代理端为被动模式情况 下
# ProxyConfigFrequency=3600
### Option: ProxyDataFrequency
#   How often Zabbix Server requests history data from a Zabbix Proxy in seconds.
#   This parameter is used only for proxies in the passive mode.
#
# Mandatory: no
# Range: 1-3600
# Default:
说明:zabbix服务端请求代理端采集的数据的频率,仅适用代理端为被动模式情况下
# ProxyDataFrequency=1
### Option: AllowRoot
#   Allow the server to run as 'root'. If disabled and the server is started by 'root', the server
#   will try to switch to user 'zabbix' instead. Has no effect if started under a regular user.
#   0 - do not allow 不允许
#   1 - allow 允许
#
# Mandatory: no
# Default:
#说明:是否允许以root身份运行服务端
# AllowRoot=0
### Option: Include
#   You may include individual files or all files in a directory in the configuration file.
#   InstallingZabbix will create include directory in /usr/local/etc, unless modified during the compile time.
#
# Mandatory: no
# Default:
#说明:在一些情况下,软件的参数配置文件很长,为了方便管理,将配置文件切割成N个配置文件,但为了主配置参数文件的简洁,便会启用INCLUDE参数,以方便程序读取指定目录下的所有配置文件
# Include=
# Include=/usr/local/etc/zabbix_server.general.conf
# Include=/usr/local/etc/zabbix_server.conf.d/
####### LOADABLE MODULES #######
### Option: LoadModulePath
#   Full path to location of server modules.
#   Default depends on compilation options.
#
# Mandatory: no
# Default:
#指定本地模块路径,非研发人员不建议修改
# LoadModulePath=${libdir}/modules
### Option: LoadModule
#   Module to load at server startup. Modules are used to extend functionality of the server.
#   Format: LoadModule=<module.so>
#   The modules must be located in directory specified by LoadModulePath.
#   It is allowed to include multiple LoadModule parameters.
#
# Mandatory: no
# Default:
#指定本地模块路径,非研发人员不建议修改
# LoadModule=
4.zabbix 配置监控nginx
4.1 配置nginx
在nginx.conf配置文件中加入
server {
        listen    80;
        server_name 127.0.0.1;
        location /nginx_status {
            stub_status on;
            access_log off;
            allow 127.0.0.1;
            allow 172.16.0.174; #允许zabbix server访问
            deny all;
        }
    }
配置完重新加载nginx,然后测试效果
[root@localhost conf]# /usr/local/nginx/sbin/nginx -c /usr/local/nginx/conf/nginx.conf -s reload
[root@localhost conf]# curl http://127.0.0.1/nginx_status
Active connections: 72
server accepts handled requests
 540651 540651 1613382
Reading: 0 Writing: 1 Waiting: 71
4.2 编写客户端脚本
[root@localhost ~]# mkdir /usr/local/zabbix/scripts
[root@localhost ~]# cat /usr/local/zabbix/scripts/nginx-status.sh
#!/bin/bash

HOST="127.0.0.1"
PORT="80"

#检测nginx进程是否存在
function ping {
    /sbin/pidof nginx | wc -l
    }
# 检测nginx性能
function active {
    /usr/bin/curl "http://$HOST:$PORT/nginx_status/" 2>/dev/null| grep 'Active' | awk '{print $NF}'
    }
function reading {
    /usr/bin/curl "http://$HOST:$PORT/nginx_status/" 2>/dev/null| grep 'Reading'| awk '{print $2}'
    }
function writing {
    /usr/bin/curl "http://$HOST:$PORT/nginx_status/" 2>/dev/null| grep 'Writing'| awk '{print $4}'
    }
function waiting {
    /usr/bin/curl "http://$HOST:$PORT/nginx_status/" 2>/dev/null| grep 'Waiting'| awk '{print $6}'
    }
function accepts {
    /usr/bin/curl "http://$HOST:$PORT/nginx_status/" 2>/dev/null| awk NR==3 | awk '{print $1}'
    }
function handled {
    /usr/bin/curl "http://$HOST:$PORT/nginx_status/" 2>/dev/null| awk NR==3 | awk '{print $2}'
    }
function requests {
    /usr/bin/curl "http://$HOST:$PORT/nginx_status/" 2>/dev/null| awk NR==3 | awk '{print $3}'
    }
#执行function
$1
给脚本加入权限
[root@localhost ~]# chmod +x /usr/local/zabbix/scripts/nginx-status.sh4.3 修改zabbix_agentd.conf
指定参数和脚本路径,重启zabbix_agentd
# UserParameter=
UserParameter=nginx.status[*],/usr/local/zabbix/scripts/nginx-status.sh $1
4.4 测试配置效果
在Zabbix Server上运行以下命令
[root@ZabbixServer etc]# zabbix_get -s 172.16.0.233 -k 'nginx.status[accepts]'
534458
[root@ZabbixServer etc]# zabbix_get -s 172.16.0.233 -k 'nginx.status[requests]'
1621474