Demo to create drawing with GR
Introduction to GR
GR is a universal framework for cross-platform visualization applications. It offers developers a compact, portable and consistent graphics library for their programs. Applications range from publication quality 2D graphs to the representation of complex 3D scenes.

GR is essentially based on an implementation of a Graphical Kernel System (GKS) and OpenGL. As a self-contained system it can quickly and easily be integrated into existing applications (i.e. using the ctypes mechanism in Python or direct calls from Julia with ccall syntax).
The GR framework can be used in imperative programming systems or integrated into modern object-oriented systems, in particular those based on GUI toolkits. GR is characterized by its high interoperability and can be used with modern web technologies and mobile devices. The GR framework is especially suitable for real-time environments.

GR was developed by the Scientific IT-Systems group at the Peter Grünberg Institute at Forschunsgzentrum Jülich. The main development has been done by Josef Heinen who currently maintains the software.
GR3 is a software library for simple visualization of 3D scenes. It was developed by Florian Rhiem as part of his bachelor’s thesis. GR3 is written in C and can also be used from Python or Julia through a wrapper module.
C library GR
Python Package gr
Julia Package GR
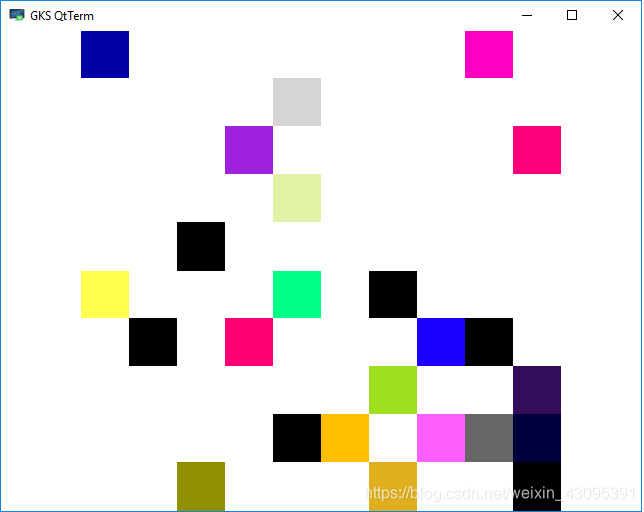
Demo to draw random rectangles with Julia lang
using GR
g = GR

# API:setwindow defines the rectangular portion of the World Coordinate space (WC) to be associated with the specified normalization transformation. The WC window and the Normalized Device Coordinates (NDC) viewport define the normalization transformation through which all output primitives are mapped. The WC window is mapped onto the rectangular NDC viewport which is, in turn, mapped onto the display surface of the open and active workstation, in device coordinates. By default, GR uses the range [0,1] x [0,1], in world coordinates, as the normalization transformation window.
# In this test we set the world coord window as(0,0) to (10,10)
# All your drawings in this area are visible (see setviewport below)
g.setwindow(0, 10, 0, 10)

# API:setviewport defines the rectangular portion of the Normalized Device Coordinate (NDC) space to be associated with the specified normalization transformation. The NDC viewport and World Coordinate (WC) window define the normalization transformation through which all output primitives pass. The WC window is mapped onto the rectangular NDC viewport which is, in turn, mapped onto the display surface of the open and active workstation, in device coordinates.
# We make the whole NDC visile
g.setviewport(0, 1, 0, 1)

# API:The line width is calculated as the nominal line width generated on the workstation multiplied by the line width scale factor. This value is mapped by the workstation to the nearest available line width. The default line width is 1.0, or 1 times the line width generated on the graphics device.
# Define the line width of subsequent polyline output primitives.
g.setlinewidth(3)

function recttest(n)
    # clear the workspace(canvas)
    g.clearws()

    # create random point x from the range of 0:9
    x = rand(0:9, n)
    # create random point y from the range of 0:9
    y = rand(0:9, n)

    drawwhat = :DrawRect
    drawwhat = :FillRect

    # draw a rect every 0.2 second ad show the updated canvas
    for i in 1:n
        if drawwhat == :DrawRect
            # Sefine the color of subsequent polyline output primitives.
            #The polyline color index (0 =< COLOR < 1256)
            g.setlinecolorind( rand(0:1256) )
            # draw rect at (x[i], y[i])
            g.drawrect(x[i],x[i]+1,y[i],y[i]+1)
        end

        if drawwhat == :FillRect
            g.setfillcolorind( rand(0:1256) )
            g.fillrect(x[i],x[i]+1,y[i],y[i]+1)
        end

        # sleep 0.2 second, to see the animation
        sleep(0.2)

        # update workspace(canvas)
        g.updatews();
    end
end


# run the test
recttest(30)