sar(System Activity Reporter, 系统活动情况报告): 是用于监控Linux系统各个性能的优秀工具,包括:文件的读写情况、系统调用的使用情况、磁盘I/O、CPU效率、内存使用状况、进程活动及IPC有关的活动等。
sar命令常用格式
sar [ options ] [ <interval> [ <count> ] ]
其中:
interval: 采样周期,单位是秒;
count:采样次数,默认值是连续采样;
options:命令行选项。
sar命令的选项很多,下面只列出常用选项:
-A:所有报告的总和
-u:输出整体CPU使用情况的统计信息
-v:输出inode、文件和其他内核表的统计信息
-d:输出每一个块设备的活动信息
-r:输出内存和交换空间的统计信息
-b:显示I/O和传送速率的统计信息
-a:文件读写情况
-c:输出进程统计信息,每秒创建的进程数
-R:输出内存页面的统计信息
-y:终端设备活动情况
-w:输出系统交换活动信息
整体I/O情况(-b)

输出项说明:
tps: 每秒向磁盘设备请求数据的次数,包括读、写请求,为rtps与wtps的和。出于效率考虑,每一次IO下发后并不是立即处理请求,而是将请求合并(merge),这里tps指请求合并后的请求计数。
rtps: 每秒向磁盘设备的读请求次数
wtps: 每秒向磁盘设备的写请求次数
bread/s:每秒钟从物理设备读入的数据量,单位为 块/s
bwrtn/s:每秒钟向物理设备写入的数据量,单位为 块/s
网络统计(-n)
使用-n选项可以对网络使用情况进行显示,-n后接关键词”DEV”可显示eth0、eth1等网卡的信息:
sar -n DEV 1 1
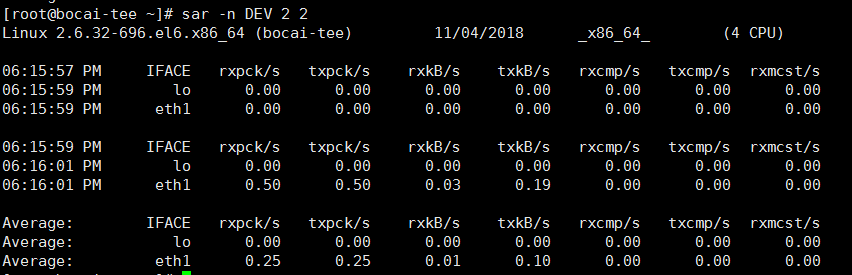
以上主要输出含义如下:
IFACE: Name of the network interface for which statistics are reported.
rxpck/s: Total number of packets received per second.
txpck/s: Total number of packets transmitted per second.
rxkB/s: Total number of kilobytes(kB) received per second.
txkB/s: Total number of kilobytes(kB) transmitted per second.
rxcmp/s: Number of compressed packets received per second (for cslip etc.).
txcmp/s: Number of compressed packets transmitted per second.
rxmcst/s: Number of multicast packets received per second.
sar日志保存(-o)
inux:~ # sar -n DEV 1 10 -o sar.out
linux:~ # sar -d 1 10 -f sar.out //查看历史的IO
linux:~ # sar -u 1 10 -f sar.out //查看历史的cpu,单位1s, 采样10次
相比将结果重定向到一个文件,使用-o选项,可以保存更多的系统资源信息。