一、基本概念
ZedGraph是用于创建任意数据的二维线型、条型、饼型图表的一个类库,也可以作为Windows窗体用户控件和Asp.Net网页控件。这个类库具有高度的适应性,几乎所有式样的图表都能够被创建。这个类库的用法在于通过提供所有图表属性的省缺值来保持使用性的简单。这个类库包含了基于要绘制的数值范围内的可选择适当度量范围和跨度的代码。
二、winform下使用zedgraph
1、下载ZedGraph.dll
2、新建winform工程,将ZedGraph.dll添加到工程中
(1)ZedGraph.dll复制到winform的debug文件下,并引用

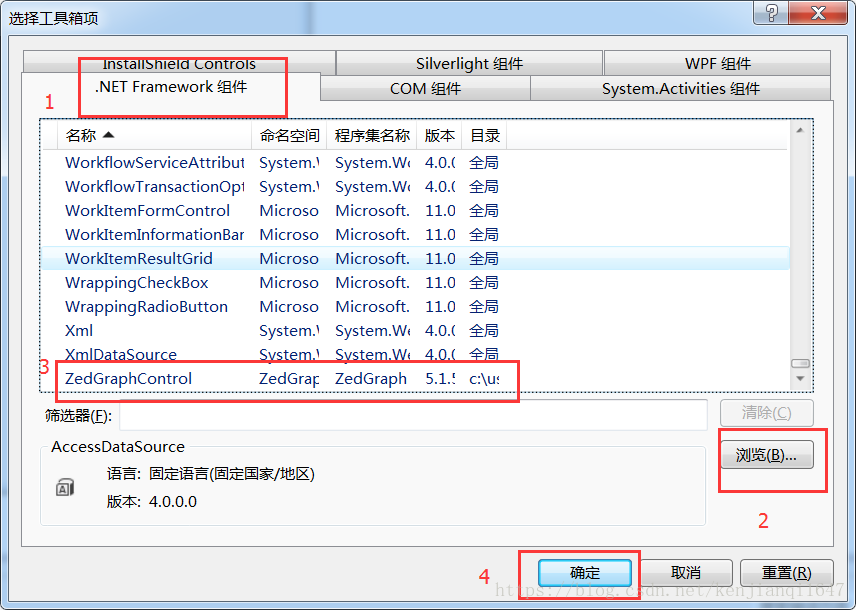
(2)将这个控件添加到工具箱中
工具箱-右键-选择项

将zedgraph添加进来
扫描二维码关注公众号,回复:
4045655 查看本文章

3、使用zedgraph
(1)工具箱中将zedgraph拖动到winform界面

(2)后台简单使用
private void zedGraphControl()
{
PointPairList list1 = new PointPairList();
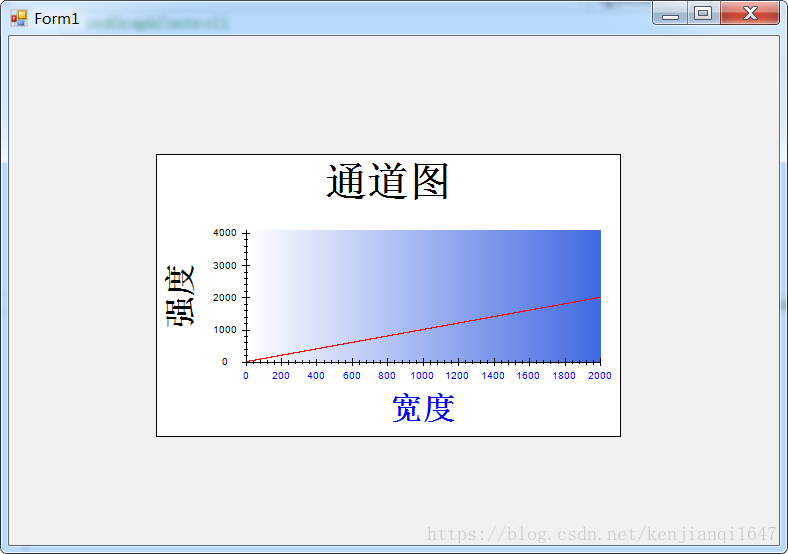
zedGraphControl1.GraphPane.Title.FontSpec.Size = 50;//设置标题大小
zedGraphControl1.GraphPane.Title.Text = "通道图";//设置标题内容
zedGraphControl1.GraphPane.XAxis.Title.FontSpec.Size = 40;//设置x轴标题大小
zedGraphControl1.GraphPane.XAxis.Title.Text = "宽度";//X轴标题
zedGraphControl1.GraphPane.XAxis.Title.FontSpec.FontColor = Color.Blue;////X轴标题颜色
zedGraphControl1.GraphPane.XAxis.Scale.FontSpec.FontColor = Color.Blue;//设置x轴刻度颜色
zedGraphControl1.GraphPane.YAxis.Title.FontSpec.Size = 40;
zedGraphControl1.GraphPane.YAxis.Title.Text = "强度";
//设置x轴的范围
zedGraphControl1.GraphPane.XAxis.Scale.Min = 0;//X轴的范围
zedGraphControl1.GraphPane.XAxis.Scale.Max = 2000;
zedGraphControl1.GraphPane.XAxis.Scale.MinorStep = 40;//X轴小刻度 小跨度
zedGraphControl1.GraphPane.XAxis.Scale.MajorStep = 200;//X轴大刻度 大跨度
//清除X、Y轴对面的轴显示
zedGraphControl1.GraphPane.Chart.Border.IsVisible = false;//图表边框设置
zedGraphControl1.GraphPane.XAxis.MajorTic.IsOpposite = false;
zedGraphControl1.GraphPane.YAxis.MajorTic.IsOpposite = false;
zedGraphControl1.GraphPane.YAxis.MinorTic.IsOpposite = false;
zedGraphControl1.GraphPane.XAxis.MinorTic.IsOpposite = false;
//设置Y轴的范围
zedGraphControl1.GraphPane.YAxis.Scale.Min = 0;
zedGraphControl1.GraphPane.YAxis.Scale.Max = 4096;
zedGraphControl1.GraphPane.YAxis.Scale.MinorStep = 200;
zedGraphControl1.GraphPane.YAxis.Scale.MajorStep = 1000;
for (int i = 0; i < 2000; i++)
{
list1.Add (i,i);
}
zedGraphControl1.GraphPane.CurveList.Clear();
zedGraphControl1.GraphPane.AddCurve("", list1, Color.Red , SymbolType.None);//绘制图表
zedGraphControl1.GraphPane.Chart.Fill = new Fill(Color.White, Color.RoyalBlue, 0.0F);//设置图表背景颜色
zedGraphControl1.GraphPane.Legend.Border.Color = Color.Blue ;
//坐标轴范围、刻度调整后需要加上下面的语句才能刷新
zedGraphControl1.AxisChange();
zedGraphControl1.Refresh();
}测试效果:
三、WPF下使用
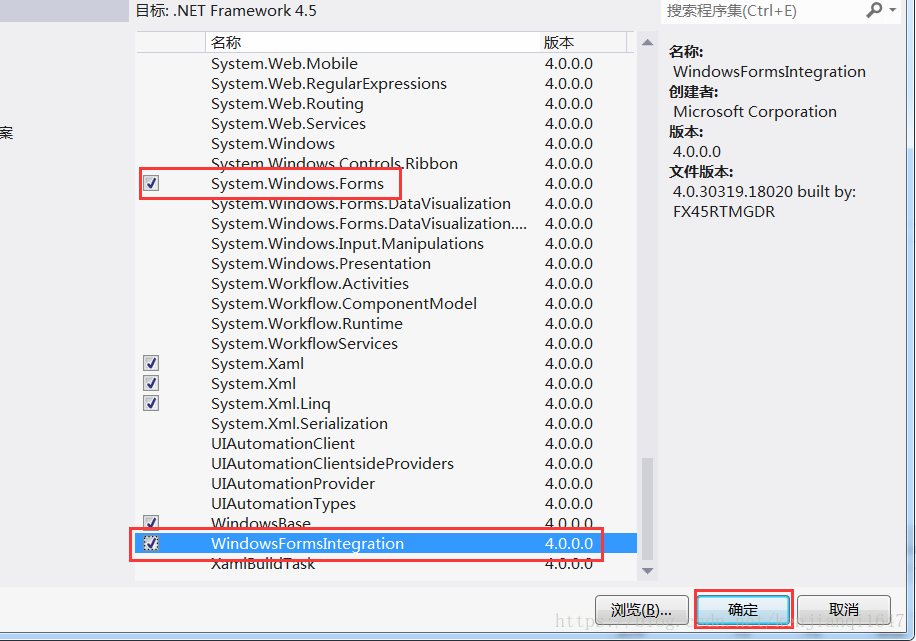
1、添加下面两个dll文件
2、引用zedgraph.dll
3、添加zedgraph
由于zedgraph是winform的控件,按照winform添加的方式发现工具箱中找不到zedgraph控件
前台XAML:
<Window x:Class="WpfZedgraph.MainWindow"
        xmlns="http://schemas.microsoft.com/winfx/2006/xaml/presentation"
        xmlns:x="http://schemas.microsoft.com/winfx/2006/xaml"
        xmlns:wfi ="clr-namespace:System.Windows.Forms.Integration;assembly=WindowsFormsIntegration"
        xmlns:wf ="clr-namespace:System.Windows.Forms;assembly=System.Windows.Forms"
        xmlns:zedgraph="clr-namespace:ZedGraph;assembly=ZedGraph"
        Title="MainWindow" Height="350" Width="525" Loaded="Window_Loaded">
    <Grid HorizontalAlignment="Left" Height="322.4" VerticalAlignment="Top" Width="518.4">
        <DataGrid HorizontalAlignment="Left" VerticalAlignment="Top" Height="322" Width="518"/>
        <wfi:WindowsFormsHost>
            <zedgraph:ZedGraphControl x:Name="zedGraphControl" />
        </wfi:WindowsFormsHost>
    </Grid>

</Window>
<wfi:WindowsFormsHost></wfi:WindowsFormsHost>即为WinForm控件的宿主容器,每一个宿主容器只能放一个WinForm控件。
后台C#:
using System;
using System.Collections.Generic;
using System.Linq;
using System.Text;
using System.Threading.Tasks;
using System.Windows;
using System.Windows.Controls;
using System.Windows.Data;
using System.Windows.Documents;
using System.Windows.Input;
using System.Windows.Media;
using System.Windows.Media.Imaging;
using System.Windows.Navigation;
using System.Windows.Shapes;
using System.Windows.Forms;
using ZedGraph;
using System.Drawing;
//using WindowsFormsIntergration;
namespace WpfZedgraph
{
    /// <summary>
    /// MainWindow.xaml 的交互逻辑
    /// </summary>
    public partial class MainWindow : Window
    {
        public MainWindow()
        {
            InitializeComponent();
        }
          private void Window_Loaded(object sender, RoutedEventArgs e)

        {
            ZedGraph.GraphPane myPane = zedGraphControl.GraphPane;
            myPane.Title.Text = "通道图";
            myPane.XAxis.Title.Text = "宽度";
            myPane.YAxis.Title.Text = "强度";
            PointPairList list1 = new PointPairList();

            for (int i = 0; i <2000; i++)

            {
                list1.Add(i, i);
            }
            LineItem myCurve = myPane.AddCurve("Porsche", list1, System.Drawing.Color.Red, SymbolType.Diamond);
            zedGraphControl.AxisChange();//刷新界面

        }

    }
}
测试效果:

四、总结
zedgraph在内存中将线画好,最后一次性出图,减少了对UI界面的刷新次数,对于数据量大,刷新速度快的线图非常适合。同时X,Y的坐标刻度和范围可以自由的由程序改变。