版权声明:本文为博主原创文章,未经博主允许不得转载。 https://blog.csdn.net/wf19930209/article/details/83819794
Angular Chart.js第三方库ng-chartjs基础使用
这个项目支持基本的Chart.js图表,并且支持内联插件和全局插件的使用。
支持图表类型
- line
- bar
- radar
- pie
- polarArea
安装
npm install ng-chartjs --save
npm install chart.js --save
导入
- 正常导入模块
import { NgChartjsModule } from 'ng-chartjs';

// In your App's module:
imports: [
   NgChartjsModule
]
- 导入全局插件
import { NgChartjsModule } from 'ng-chartjs';

// In your App's module:
imports: [
   NgChartjsModule.registerPlugin([...])
]
图表使用
使用ngChartjs指令即可,chartType、labels、datasets或data,必须输入。
html file.
<canvas ngChartjs [datasets]="lineChartData" [labels]="lineChartLabels"
          [options]="lineChartOptions" [legend]="lineChartLegend" [chartType]="lineChartType"
          [inlinePlugins]="inlinePlugin">
</canvas>
ts file.
...
lineChartData: Array<any> = [
{
label: 'My First dataset',
fill: false,
lineTension: 0.1,
backgroundColor: 'rgba(75,192,192,0.4)',
borderColor: 'rgba(75,192,192,1)',
borderCapStyle: 'butt',
borderDash: [],
borderDashOffset: 0.0,
borderJoinStyle: 'miter',
pointBorderColor: 'rgba(75,192,192,1)',
pointBackgroundColor: '#fff',
pointBorderWidth: 1,
pointHoverRadius: 5,
pointHoverBackgroundColor: 'rgba(75,192,192,1)',
pointHoverBorderColor: 'rgba(220,220,220,1)',
pointHoverBorderWidth: 2,
pointRadius: 1,
pointHitRadius: 10,
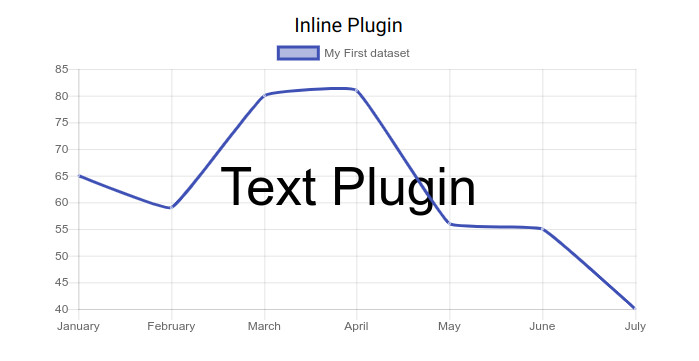
data: [65, 59, 80, 81, 56, 55, 40],
},
];
lineChartLabels: Array<any> = ['January', 'February', 'March', 'April', 'May', 'June', 'July'];
lineChartOptions: any = {
responsive: true
};
lineChartLegend = true;
lineChartType = 'line';
inlinePlugin: any;
textPlugin: any;
ngOnInit() {
// inline plugin
this.textPlugin = [{
id: 'textPlugin',
beforeDraw(chart: any): any {
const width = chart.chart.width;
const height = chart.chart.height;
const ctx = chart.chart.ctx;
ctx.restore();
const fontSize = (height / 114).toFixed(2);
ctx.font = `${fontSize}em sans-serif`;
ctx.textBaseline = 'middle';
const text = 'Text Plugin';
const textX = Math.round((width - ctx.measureText(text).width) / 2);
const textY = height / 2;
ctx.fillText(text, textX, textY);
ctx.save();
}
}];
this.inlinePlugin = this.textPlugin;
}
...
View
属性

事件
- chartClick : fires when click on a chart has occurred, returns information regarding active points and labels
- chartHover : fires when mousemove (hover) on a chart has occurred, returns information regarding active points and labels