1、导入模块
from matplotlib import pyplot as plt
import numpy as np
from mpl_toolkits.mplot3d
import Axes3D
2、生成数据
X = np.arange(-4, 4, 0.25)
Y = np.arange(-4, 4, 0.25)
X, Y = np.meshgrid(X, Y)
R = np.sqrt(X**2 + Y**2)
Z = np.sin(R)
3、散点图
ax=plt.subplot(111,projection='3d')
ax.scatter(X, Y, Z ,c="r")
plt.show()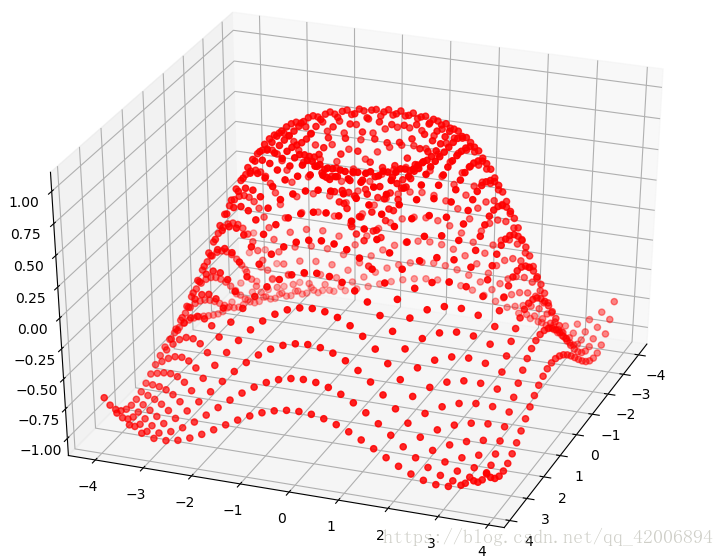
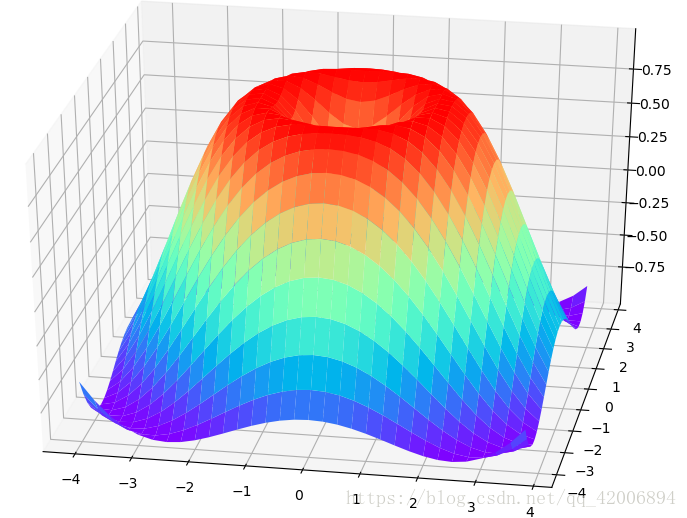
4、曲面图
fig = plt.figure()
ax = Axes3D(fig)
ax.plot_surface(X, Y, Z, rstride=1, cstride=1, cmap='rainbow')
plt.show()