https://blog.csdn.net/jasonzhoujx/article/details/81780774
import matplotlib.pyplot as plt
import numpy as np
from mpl_toolkits.mplot3d import Axes3D
fig = plt.figure()
### z= x,y
def h(x):
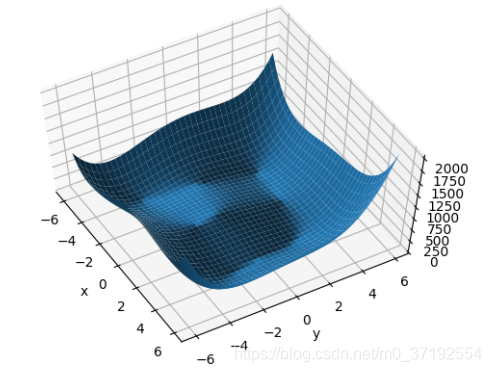
return (x[0]**2+x[1]-11)**2+(x[0]+x[1]**2-7)**2
x=np.arange(-6,6,0.1)
y=np.arange(-6,6,0.1)
print("x,y range: ",x.shape,y.shape)
x,y=np.meshgrid(x,y)
print('x,y maps:',x.shape,y.shape)
z=h([x,y])
ax = fig.gca(projection='3d')
ax.view_init(60,-30)
ax.plot_surface(x,y,z)
ax.set_xlabel("x")
ax.set_ylabel("y")
plt.show()
