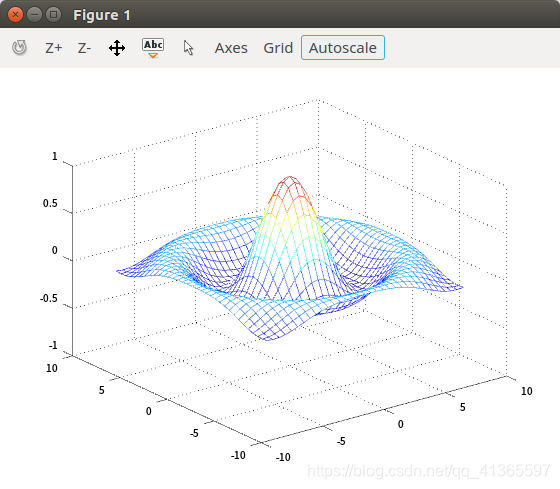
MATLAB/octave
x = -8:0.5:8;
y = x;
[X,Y] = meshgrid(x,y);
R = sqrt(X.^2+Y.^2)+eps;
Z = sin(R)./R;
mesh(X,Y,Z);
grid on
axis([-10 10 -10 10 -1 1])
Xlabel('x')
Ylabel('Y')
Zlabel('Z')
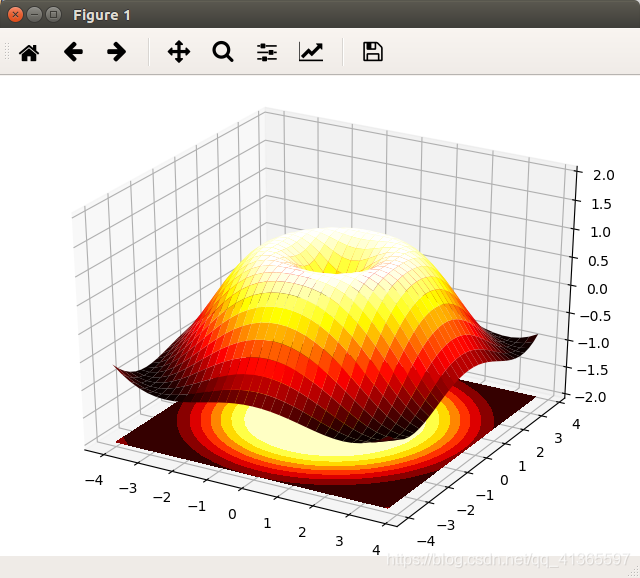
python
import numpy as np
import matplotlib.pyplot as plt
from mpl_toolkits.mplot3d import Axes3D

fig = plt.figure()
ax = Axes3D(fig)
X = np.arange(-4, 4, 0.25)
Y = np.arange(-4, 4, 0.25)
X, Y = np.meshgrid(X, Y)
R = np.sqrt(X ** 2 + Y ** 2)
Z = np.sin(R)

ax.plot_surface(X, Y, Z, rstride=1, cstride=1, cmap=plt.cm.hot)
ax.contourf(X, Y, Z, zdir='z', offset=-2, cmap=plt.cm.hot)
ax.set_zlim(-2, 2)

plt.show()