闲聊的时候看到一张图片,一家网站的18岁认证,顿时就想吐槽,这是针对中学生的吧。
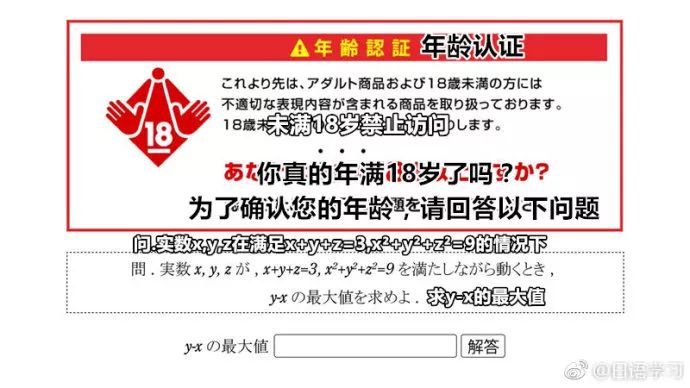
既然勾起了兴趣,就试着做一下。
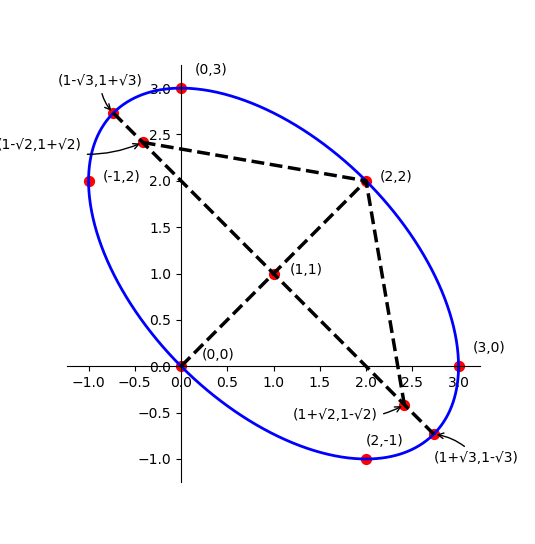
x+y+z=3在三维坐标系中是一个平面,x^2+y^2+z^2=9是一个球,它俩相截得到的是一个圆心在(1,1,1),经过(0,0,3),(0,3,0),(3,0,0),(2,2,-1),(2,-1,2),(-1,2,2)的圆,在二维坐标系的投影是一个中心在(1,1),经过(0,0),(0,3),(3,0),(2,2),(2,-1),(-1,2)的椭圆,x,y就在椭圆上取值。这个椭圆的方程是x^2+y^2-3x-3y+xy=0,求y-x的最值,就是求切线斜率为45度的切点。
粗略画一个草图,目测椭圆的斜率是-45度(事实上也确实是),所以可以这样计算四周的点:
当x=y,可得(0,0),(2,2);当x+y=2,可得(1-√3,1+√3),(1+√3,1-√3),所以椭圆a=√6,b=√2,焦点是(1-√2,1+√2),(1+√2,1-√2)。当位于(1-√3,1+√3)时,y-x的最大值是2√3,至于怎么证明这个点的切线斜率是45度,母鸡了╮(╯_╰)╭。
问题已经解决,这时候我又想,可不可以用程序把它画出来呢,这样显得比较有bigger。于是就上网搜了一下matplotlib的知识点,把demo拿过来稍微修改了一下。有时候完成需求真的不需要去细学每个知识点,那样会给自己太大负担。比如我安装的漫画自动翻页的油猴脚本失效了,于是就想着看自己能不能修。但是js方面我是外行,如果去补基础,搞明白脚本里每一条语句的意思,不知道需要多少天呢。后来发现脚本失效的原因是那家网站img src url的格式变了,所以找不到图。把解析url的正则表达式修改一下就好啦,解决问题只用了不到一小时。
img代码是这样的:

原本的格式是/4085/219/005.png或者.html什么的,无从得知,现在把后面的去掉了。
所以把
修改为
画图这个需求的重点在于计算椭圆点集,至于怎么操作图像,抄就好了。
代码如下:
 1 # -*- coding: utf-8 -*-
 2
 3 import matplotlib.pyplot as plt
 4 import numpy as np
 5 from matplotlib.patches import Ellipse
 6 import math
 7
 8 #利用matplotlib的Ellipse函数,提供中心点,长,宽,斜率,来计算点集
 9 def method1():
10     delta = -45.0 # degrees
11
12     ell = Ellipse((1, 1), 2*math.sqrt(6), 2*math.sqrt(2), delta)
13
14     a = plt.subplot(111)
15     ell.set_clip_box(a.bbox)
16     ell.set_alpha(0.1)
17     a.add_artist(ell)
18
19     plt.xlim(-1.5, 3.5)
20     plt.ylim(-1.5, 3.5)
21     plt.show()
22
23 #利用椭圆的参数方程x=acosθ, y=bsinθ,和三角函数和差公式(旋转)来计算x,y点集
24 def method2():
25     plt.subplot(111)
26
27     #设置坐标轴
28     ax = plt.gca()
29     ax.spines['right'].set_color('none')
30     ax.spines['top'].set_color('none')
31     ax.xaxis.set_ticks_position('bottom')
32     ax.spines['bottom'].set_position(('data',0))
33     ax.yaxis.set_ticks_position('left')
34     ax.spines['left'].set_position(('data',0))
35
36     theta = np.linspace(0, 2*np.pi,800)
37     delta = math.pi/4
38     #椭圆公式
39     x,y = np.cos(theta)*math.sqrt(6), np.sin(theta)*math.sqrt(2)
40     #旋转+平移
41     X,Y = 1+x*math.cos(delta)+y*math.sin(delta),1+y*math.cos(delta)-x*math.sin(delta)
42     #plt.plot(x, y, color='red', linewidth=2.0)
43     plt.plot(X, Y, color='blue', linewidth=2.0)
44
45     px = [0,0,3,2,2,-1,1,1-math.sqrt(3),1+math.sqrt(3),1-math.sqrt(2),1+math.sqrt(2)]
46     py = [0,3,0,2,-1,2,1,1+math.sqrt(3),1-math.sqrt(3),1+math.sqrt(2),1-math.sqrt(2)]
47     #画点
48     plt.scatter(px,py, 50, color ='red')
49     #画线
50     plt.plot([1-math.sqrt(3),1+math.sqrt(3)],[1+math.sqrt(3),1-math.sqrt(3)], color ='black', linewidth=2.5, linestyle="--")
51     plt.plot([0,2],[0,2], color ='black', linewidth=2.5, linestyle="--")
52     plt.plot([1-math.sqrt(2),2,1+math.sqrt(2)],[1+math.sqrt(2),2,1-math.sqrt(2)], color ='black', linewidth=2.5, linestyle="--")
53     #标注
54     plt.annotate('(0,0)',(0,0),xytext=(+15, +5), textcoords='offset points')
55     plt.annotate('(0,3)',(0,3),xytext=(+10, +10), textcoords='offset points')
56     plt.annotate('(3,0)',(3,0),xytext=(+10, +10), textcoords='offset points')
57     plt.annotate('(2,2)',(2,2),xytext=(+10, 0), textcoords='offset points')
58     plt.annotate('(2,-1)',(2,-1),xytext=(0, +10), textcoords='offset points')
59     plt.annotate('(-1,2)',(-1,2),xytext=(+10, 0), textcoords='offset points')
60     plt.annotate('(1,1)',(1,1),xytext=(+12, 0), textcoords='offset points')
61     plt.annotate('(1-√3,1+√3)',(1-math.sqrt(3),1+math.sqrt(3)),xytext=(-40, +20), textcoords='offset points',
62     arrowprops=dict(arrowstyle="->", connectionstyle="arc3,rad=.2"))
63     plt.annotate('(1+√3,1-√3)',(1+math.sqrt(3),1-math.sqrt(3)),xytext=(0, -20), textcoords='offset points',
64     arrowprops=dict(arrowstyle="->", connectionstyle="arc3,rad=.2"))
65     plt.annotate('(1-√2,1+√2)',(1-math.sqrt(2),1+math.sqrt(2)),xytext=(-105, -5), textcoords='offset points',
66     arrowprops=dict(arrowstyle="->", connectionstyle="arc3,rad=.2"))
67     plt.annotate('(1+√2,1-√2)',(1+math.sqrt(2),1-math.sqrt(2)),xytext=(-80, -10), textcoords='offset points',
68     arrowprops=dict(arrowstyle="->", connectionstyle="arc3,rad=.2"))
69
70     plt.show()
71
72 if __name__ == '__main__':
73 #    method1()
74     method2()
最后运行结果是这样的: