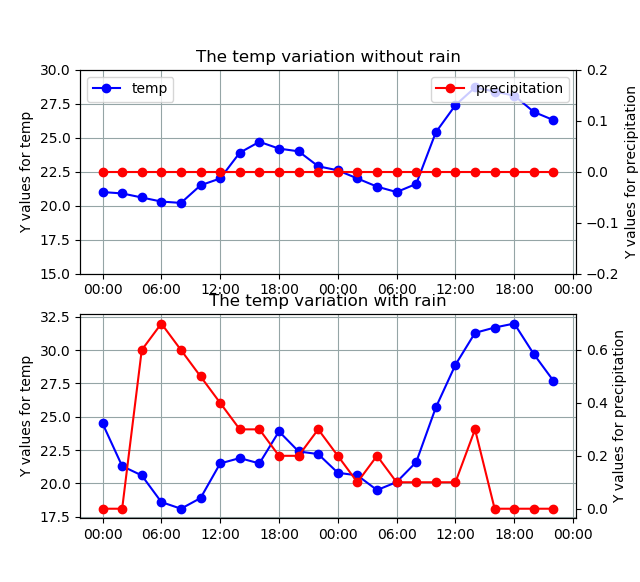
1、双Y轴,不同坐标范围
 1 def double_Y_axis():
 2     #sns.set_style("darkgrid")
 3
 4     without_rain  = pd.read_csv("./data/s1201/S1201_2015_5_26.csv")
 5     with_rain     = pd.read_csv("./data/s1201/S1201_2016_5_25.csv")
 6
 7     y1_1= without_rain['TEMP']
 8     y1_2 = without_rain['PRECIPITATIONAMOUNT']
 9     x1 = without_rain['OBSTIME']
10
11     y2_1 = with_rain['TEMP']
12     y2_2 = with_rain['PRECIPITATIONAMOUNT']
13     x2 = with_rain['OBSTIME']
14
15     day_1 = [parser(x) for x in x1]
16     day_2 = [parser(x) for x in x2]
17
18
19     fig = plt.figure()
20     ax1_1 = fig.add_subplot(211)
21     ax2_1 = fig.add_subplot(212)
22
23     ax1_2 = ax1_1.twinx()
24     ax2_2 = ax2_1.twinx()
25
26     ax1_1.plot(day_1 ,y1_1, 'b',marker='o',label='temp')
27     ax1_2.plot(day_1,y1_2,'r',marker='o',label='precipitation')
28
29     ax2_1.plot(day_2 ,y2_1, 'b',marker='o',label= 'temp')
30     ax2_2.plot(day_2,y2_2,'r',marker='o',label = 'precipitation')
31
32     hours = mdates.DateFormatter('%H:%M')
33
34     ax1_1.set_title("The temp variation without rain")
35     ax1_1.set_ylabel('Y values for temp')
36     ax1_2.set_ylabel('Y values for precipitation')
37     ax1_2.set_ylim(-0.2,0.2,0.1)
38     ax1_1.set_ylim(15,30)
39
40     ax2_1.set_title("The temp variation with rain")
41     ax2_1.set_ylabel('Y values for temp')
42     ax2_2.set_ylabel('Y values for precipitation')
43     ax1_1.xaxis.set_major_formatter(hours)
44     ax2_1.xaxis.set_major_formatter(hours)
45     ax1_1.grid(color = '#95a5a6')
46     ax2_1.grid(color = '#95a5a6')
47
48     ax1_1.legend()
49     ax1_2.legend()
50
51     plt.show()
显示: