用Python 绘制 柱状图,使用的是bar()函数。
一个简单的例子:
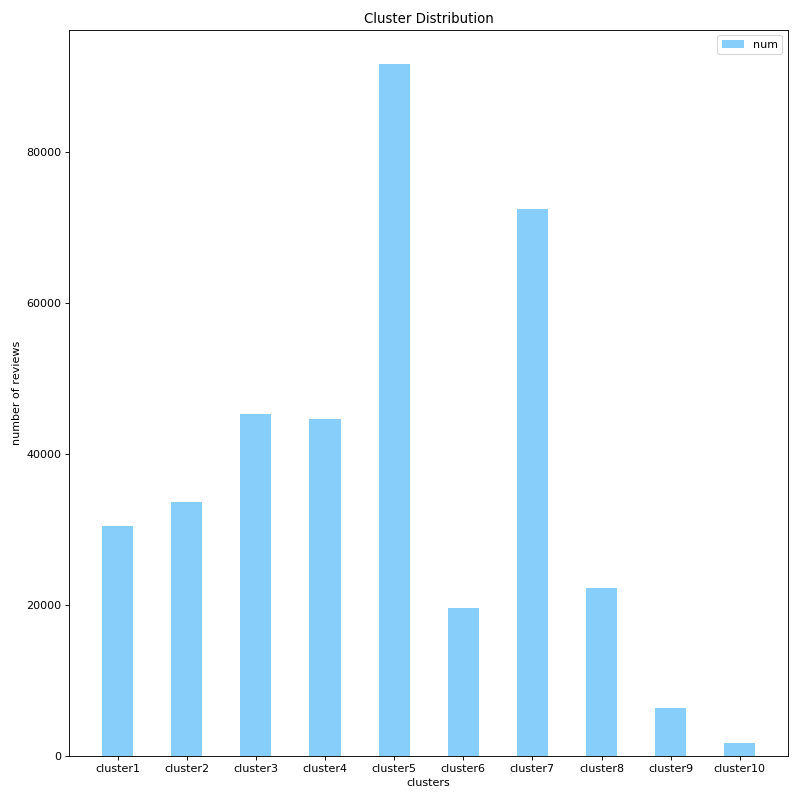
# 创建一个点数为 8 x 6 的窗口, 并设置分辨率为 80像素/每英寸
plt.figure(figsize=(10, 10), dpi=80)
# 再创建一个规格为 1 x 1 的子图
# plt.subplot(1, 1, 1)
# 柱子总数
N = 10
# 包含每个柱子对应值的序列
values = (56796,42996,24872,13849,8609,5331,1971,554,169,26)
# 包含每个柱子下标的序列
index = np.arange(N)
# 柱子的宽度
width = 0.45
# 绘制柱状图, 每根柱子的颜色为紫罗兰色
p2 = plt.bar(index, values, width, label="num", color="#87CEFA")
# 设置横轴标签
plt.xlabel('clusters')
# 设置纵轴标签
plt.ylabel('number of reviews')
# 添加标题
plt.title('Cluster Distribution')
# 添加纵横轴的刻度
plt.xticks(index, ('mentioned1cluster', 'mentioned2cluster', 'mentioned3cluster', 'mentioned4cluster', 'mentioned5cluster', 'mentioned6cluster', 'mentioned7cluster', 'mentioned8cluster', 'mentioned9cluster', 'mentioned10cluster'))
# plt.yticks(np.arange(0, 10000, 10))
# 添加图例
plt.legend(loc="upper right")
plt.show()
结果:
【Reference】
1、https://blog.csdn.net/qq_41011336/article/details/83016709 (含参数解释)