数据可视化指的是通过可视化表示来探索数据,它与数据挖掘紧密相关,而数据挖掘指的是使用代码来探索数据集的规律和关联。
15.1 安装matplotlib

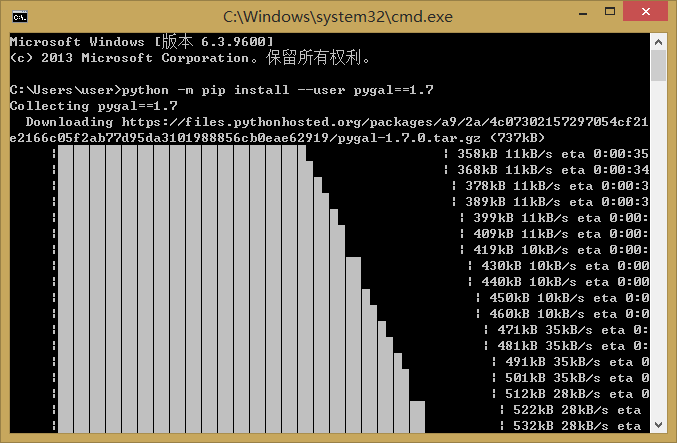
安装必要的包后,对安装进行测试。为此需要使用命令python或者python3启动一个终端会话,再尝试导入matplotlib:
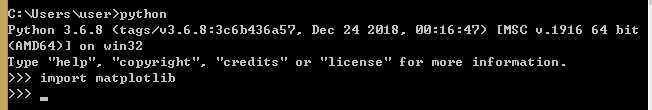
没有错误就说明你的系统安装了matplotlib。
15.2 绘制简单的折线图
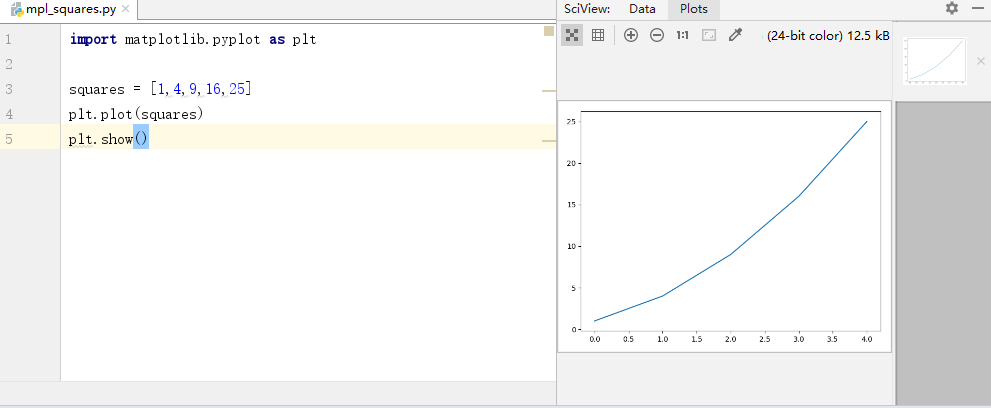
模块pyplot:包含很多用于生成图像表的函数
函数plot():尝试根据这些数字绘制出有意义的图形。
plot.show():打开matplotlib查看器,并显示绘制的图形。
查看器能够缩放和导航图形,单击磁盘图标可以将图像保存起来。
15.2.1 修改标签文字和线条粗细
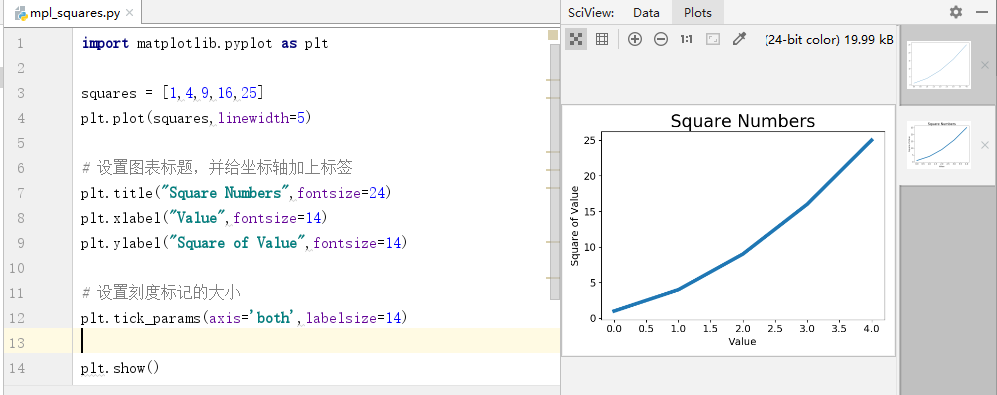
参数linewidth:决定plot()绘制的线条粗细
函数title():给图标指定标题
函数xlabel()和ylabel():为每条轴设置标题
函数tick_params():设置刻度的样式。
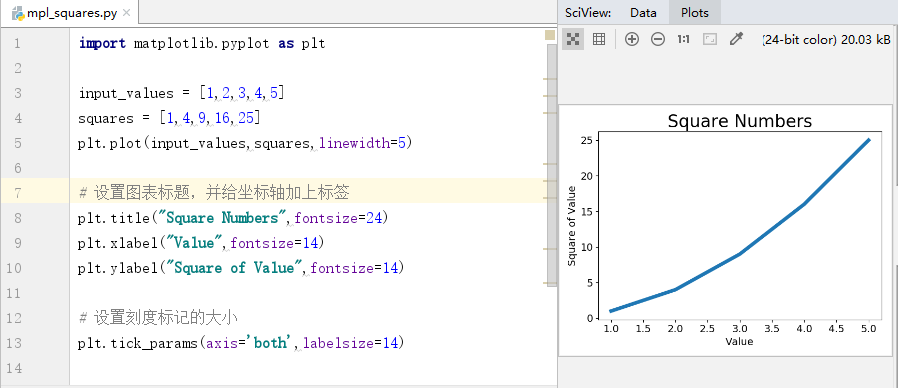
15.2.2 校正图形
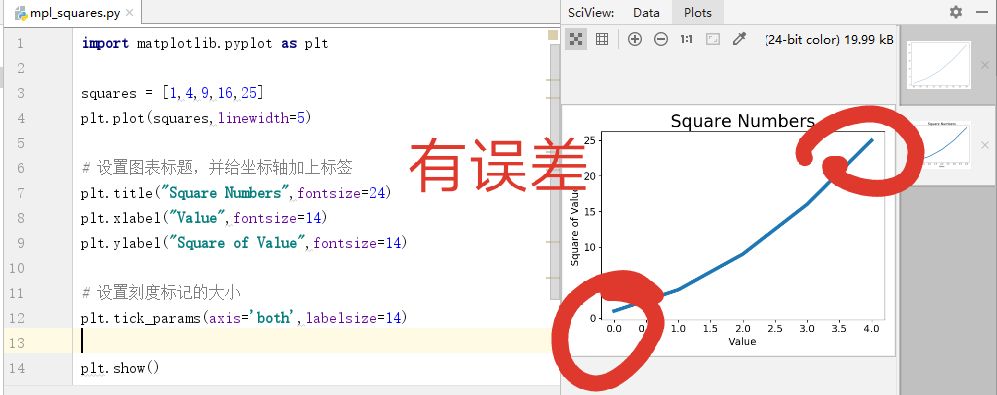
为调整误差,改变这种默认行为,我们可以给plot()同时提供输入和输出值:
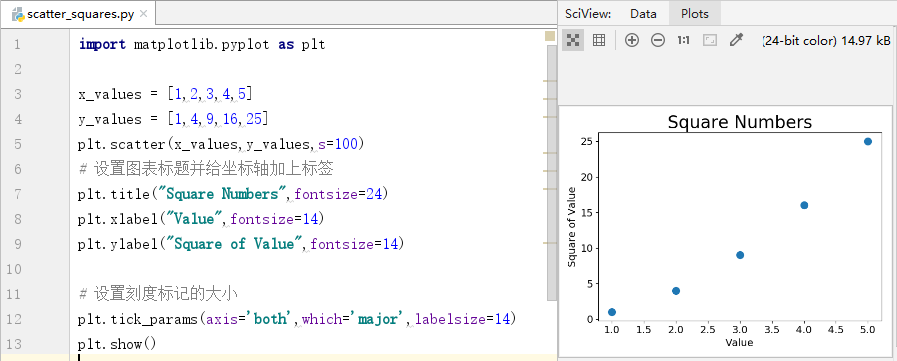
15.2.3 使用scatter()绘制散点图并设置其样式
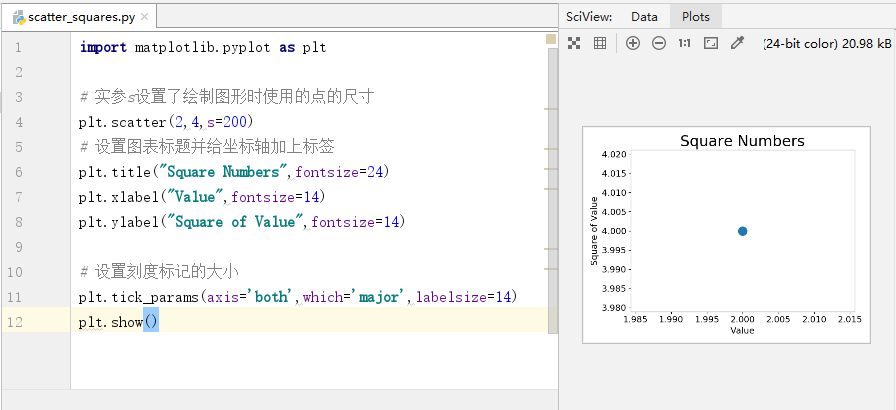
scatter()函数:可以绘制单个点,向它传递一对x和y坐标。实参s设置点的尺寸。
可以绘制一系列点,向它传递两个分别包含x值和y值的列表。如下所示。
15.2.4 使用scatter()绘制一系列点
15.2.5 自动计算数据
下面绘制1000个点:
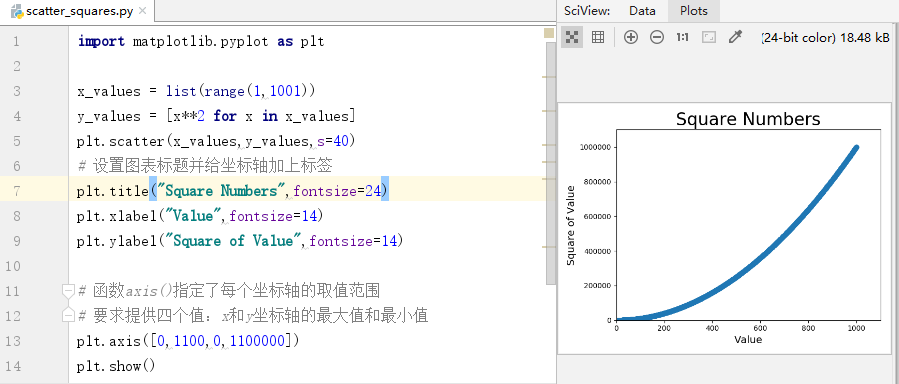
函数axis():指定了每个坐标轴的取值范围
要求提供四个值:x和y坐标轴的最大值和最小值
15.2.6 删除数据点的轮廓
matplotlib允许你给散点图中的各个点指定颜色。默认为蓝色点和黑色轮廓。要删除数据点的轮廓,可在调用scatter()时传递实参edgecolor = 'none'(在2.0.0版本的matplotlib中,scatter()函数的实参edgecolor默认为none)
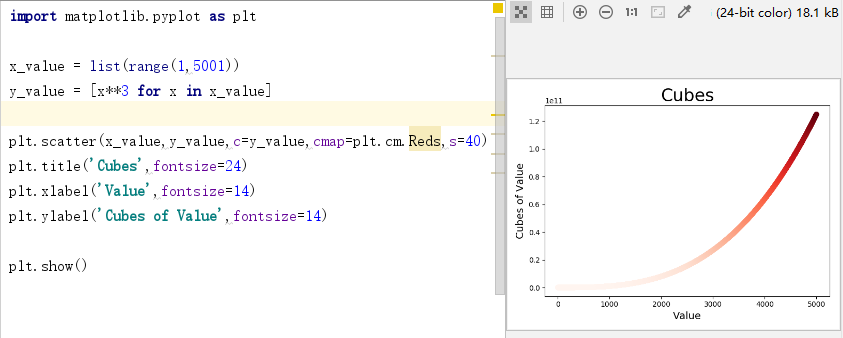
15.2.7 自定义颜色
要修改数据点的颜色,可向scatter()传递实参c,并将其设置为要使用的颜色的名称。
还可以使用RGB颜色模式自定义。值越接近0,指定的颜色越深,值越接近1,指定的颜色越浅。

15.2.8 使用颜色映射
颜色映射是一系列颜色,它们从起始颜色渐变到结束颜色。在可视化中,颜色映射用于突出数据的规律。
例如,你可能用较浅的颜色来显示较小值,并使用较深的颜色来显示较大的值。
模块pyplot内置了一组颜色映射。要使用这些颜色映射,你需要告诉python该如何设置数据集中每个点的颜色。
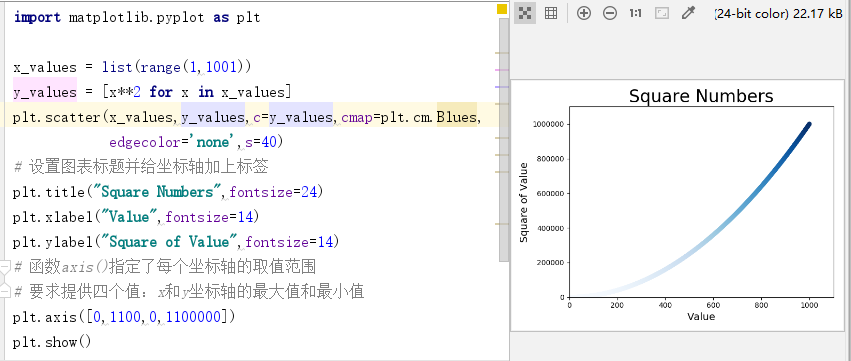
  将参数c设置成了一个y值列表,并使用参数cmap告诉pyplot使用哪个颜色映射。
15.2.9 自动保存图表
要让程序自动将图表保存到文件中,可将plt.show()的调用替换为plt.savefig()的调用:
# 第一个实参指定要以什么样的文件名保存图表,这个文件将存储到scatter_squares.py所在的目录中;
# 第二个实参指定将图表多余的空白区域裁剪掉。
plt.savefig('squares_plot.png',bbox_inches='tight')
p295

解答:

15.3 随机漫步
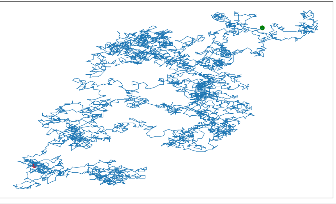
随机漫步是这样行走得到的路径:每次行走都完全是随机的,没有明确的方向,结果是由一系列随机决策决定的。
15.3.1 创建RandomWalk()类
from random import choiceclass RandomWalk():
    """一个生成随机漫步数据的类"""

    def __init__(self,num_points=5000):
        """初始化随机漫步的属性"""
        self.num_points = num_points

        # 随机漫步都始于(0,0)
        self.x_values = [0]
        self.y_values = [0]
    def fill_walk(self):
        """计算随机漫步包含的所有点"""

        # 不断漫步,直到列表达到指定的长度
        while len(self.x_values) < self.num_points:
            # 决定前进方向以及沿这个方向前进的距离
            # choice([1,-1])结果要么是表示向右走1,要么是向左走-1
            # choice([0,1,2,3,4])随机选择一个0~4之间的整数,告诉Python沿指定的方向走多远
            # 通过包含0,不仅能在x轴移动,还能够沿y轴移动
            x_direction = choice([1,-1])
            x_distance = choice([0,1,2,3,4])
            x_step = x_direction * x_distance

            y_direction = choice([1,-1])
            y_distance = choice([0,1,2,3,4])
            y_step = y_direction * y_distance

            # 拒绝原地踏步
            if x_step == 0 and y_step == 0:
                continue

            # 计算下一个点的x和y值
            next_x = self.x_values[-1] + x_step
            next_y = self.y_values[-1] + y_step

            self.x_values.append(next_x)
            self.y_values.append(next_y)
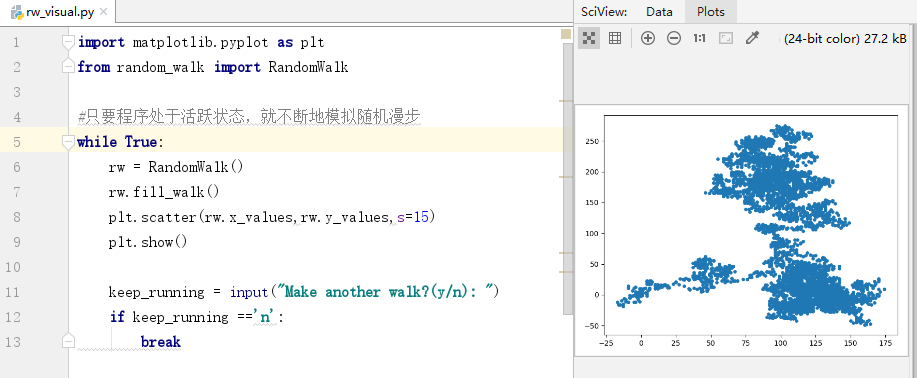
15.3.3 绘制随机漫步图

15.3.4模拟多次随机漫步

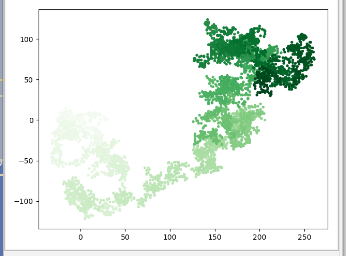
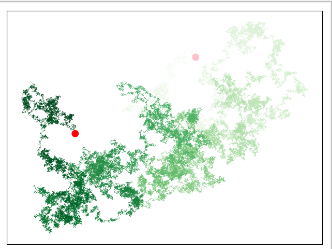
15.3.6 给点着色
我们将用颜色映射来指出漫步中各点的先后顺序。
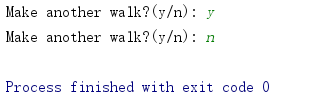
import matplotlib.pyplot as plt
from random_walk import RandomWalk

#只要程序处于活跃状态,就不断地模拟随机漫步
while True:
    rw = RandomWalk()
    rw.fill_walk()

    point_numbers = list(range(rw.num_points))
    plt.scatter(rw.x_values,rw.y_values,c=point_numbers,cmap=plt.cm.Greens,
                edgecolors='none',s=15)
    plt.show()

    keep_running = input("Make another walk?(y/n): ")
    if keep_running =='n':
        break
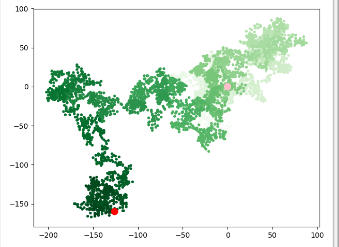
15.3.7 重新绘制起点和终点
import matplotlib.pyplot as plt
from random_walk import RandomWalk

#只要程序处于活跃状态,就不断地模拟随机漫步
while True:
    rw = RandomWalk()
    rw.fill_walk()

    point_numbers = list(range(rw.num_points))
    plt.scatter(rw.x_values,rw.y_values,c=point_numbers,cmap=plt.cm.Greens,
                edgecolors='none',s=15)
    # 突出起点和终点
    plt.scatter(0,0,c='pink',edgecolors='none',s=100)
    plt.scatter(rw.x_values[-1],rw.y_values[-1],c='red',
                edgecolors='none',s=100)
    plt.show()

    keep_running = input("Make another walk?(y/n): ")
    if keep_running =='n':
        break
15.3.8 隐藏坐标轴,增加点数
import matplotlib.pyplot as plt
from random_walk import RandomWalk

#只要程序处于活跃状态,就不断地模拟随机漫步
while True:
    rw = RandomWalk(50000)
    rw.fill_walk()

    point_numbers = list(range(rw.num_points))
    plt.scatter(rw.x_values,rw.y_values,c=point_numbers,cmap=plt.cm.Greens,
                edgecolors='none',s=1)
    # 突出起点和终点
    plt.scatter(0,0,c='pink',edgecolors='none',s=100)
    plt.scatter(rw.x_values[-1],rw.y_values[-1],c='red',
                edgecolors='none',s=100)

    # 隐藏坐标轴
    plt.axes().get_xaxis().set_visible(False)
    plt.axes().get_yaxis().set_visible(False)

    plt.show()

    keep_running = input("Make another walk?(y/n): ")
    if keep_running =='n':
        break
15.3.10 调整尺寸以适合屏幕
函数figure()用于指定图标的宽度、高度、分辨率和背景色。
# 设置绘图窗口的尺寸
    plt.figure(figsize=(10,6))
p303
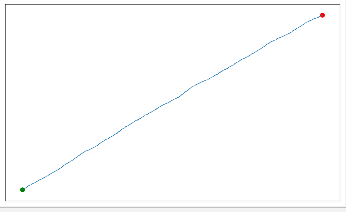
15-3
import matplotlib.pyplot as plt
from random_walk import RandomWalk

#只要程序处于活跃状态,就不断地模拟随机漫步
while True:
    rw = RandomWalk(5000)
    rw.fill_walk()

    # 设置绘图窗口的尺寸
    plt.figure(figsize=(10,6))

    point_numbers = list(range(rw.num_points))
    # plt.scatter(rw.x_values,rw.y_values,c=point_numbers,cmap=plt.cm.Greens,
    #             edgecolors='none',s=1)
    plt.plot(rw.x_values,rw.y_values,linewidth=1)
    # 突出起点和终点
    plt.scatter(0,0,c='green',edgecolors='none',s=100)
    plt.scatter(rw.x_values[-1],rw.y_values[-1],c='red',
                edgecolors='none',s=100)

    # 隐藏坐标轴
    plt.axes().get_xaxis().set_visible(False)
    plt.axes().get_yaxis().set_visible(False)

    plt.show()

    keep_running = input("Make another walk?(y/n): ")
    if keep_running =='n':
        break
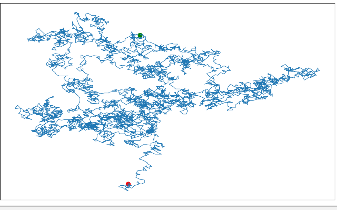
15-4
from random import choice
import matplotlib.pyplot as plt

class RandomWalk():
    """一个生成随机漫步数据的类"""

    def __init__(self,num_points=5000):
        """初始化随机漫步的属性"""
        self.num_points = num_points

        # 随机漫步都始于(0,0)
        self.x_values = [0]
        self.y_values = [0]
    def fill_walk(self):
        """计算随机漫步包含的所有点"""

        # 不断漫步,直到列表达到指定的长度
        while len(self.x_values) < self.num_points:
            x_direction = choice([1,0])
            x_distance = choice([0,1,2,3,4,5,6,7,8])
            x_step = x_direction * x_distance

            y_direction = choice([1,0])
            y_distance = choice([0,1,2,3,4,5,6,7,8])
            y_step = y_direction * y_distance

            # 拒绝原地踏步
            if x_step == 0 and y_step == 0:
                continue

            # 计算下一个点的x和y值
            next_x = self.x_values[-1] + x_step
            next_y = self.y_values[-1] + y_step

            self.x_values.append(next_x)
            self.y_values.append(next_y)
15-5
from random import choice
import matplotlib.pyplot as plt

class RandomWalk():
    """一个生成随机漫步数据的类"""

    def __init__(self,num_points=5000):
        """初始化随机漫步的属性"""
        self.num_points = num_points

        # 随机漫步都始于(0,0)
        self.x_values = [0]
        self.y_values = [0]

    def get_step(self):
        direction = choice([1, -1])
        distance = choice([0, 1, 2, 3, 4])
        step = direction * distance
        return step

    def fill_walk(self):
        """计算随机漫步包含的所有点"""

        # 不断漫步,直到列表达到指定的长度
        while len(self.x_values) < self.num_points:
            x_step = self.get_step()
            y_step = self.get_step()

            # Reject moves that go nowhere.
            if x_step == 0 and y_step == 0:
                continue

            next_x = self.x_values[-1] + x_step
            next_y = self.y_values[-1] + y_step

            self.x_values.append(next_x)
            self.y_values.append(next_y)
15.4 使用Pygal模拟掷骰子
15.4.1安装Pygal
15.4.2 Pygal 画廊
http://www.pygal.org/ 单击Documentation,再单击Chart types。
15.4.3 创建Die类
from random import randint

class Die():
    """表示一个骰子的类"""

    def __init__(self,num_sides=6):
        """骰子默认6面"""
        self.num_sides = num_sides

    def roll(self):
        """返回一个位于1和骰子面数之间的随机值"""
        return randint(1,self.num_sides)
15.4.4 掷骰子、分析结果
from die import Die

# 创建一个D6
die = Die()

# 掷几次骰子,并将结果存储在一个列表中
results = []
for roll_num in range(1000):
    result = die.roll()
    results.append(result)
frequencies = []
# 计算每个点数出现的次数
for value in range(1,die.num_sides+1):
    frequency = results.count(value)
    frequencies.append(frequency)
print(frequencies)
[141, 177, 152, 182, 171, 177]
15.4.6 绘制直方图
直方图是一种条形图,指出了各种结果出现的频率。在任何Web浏览器中新建一个标签页,再在其中打开die_visual.svg。
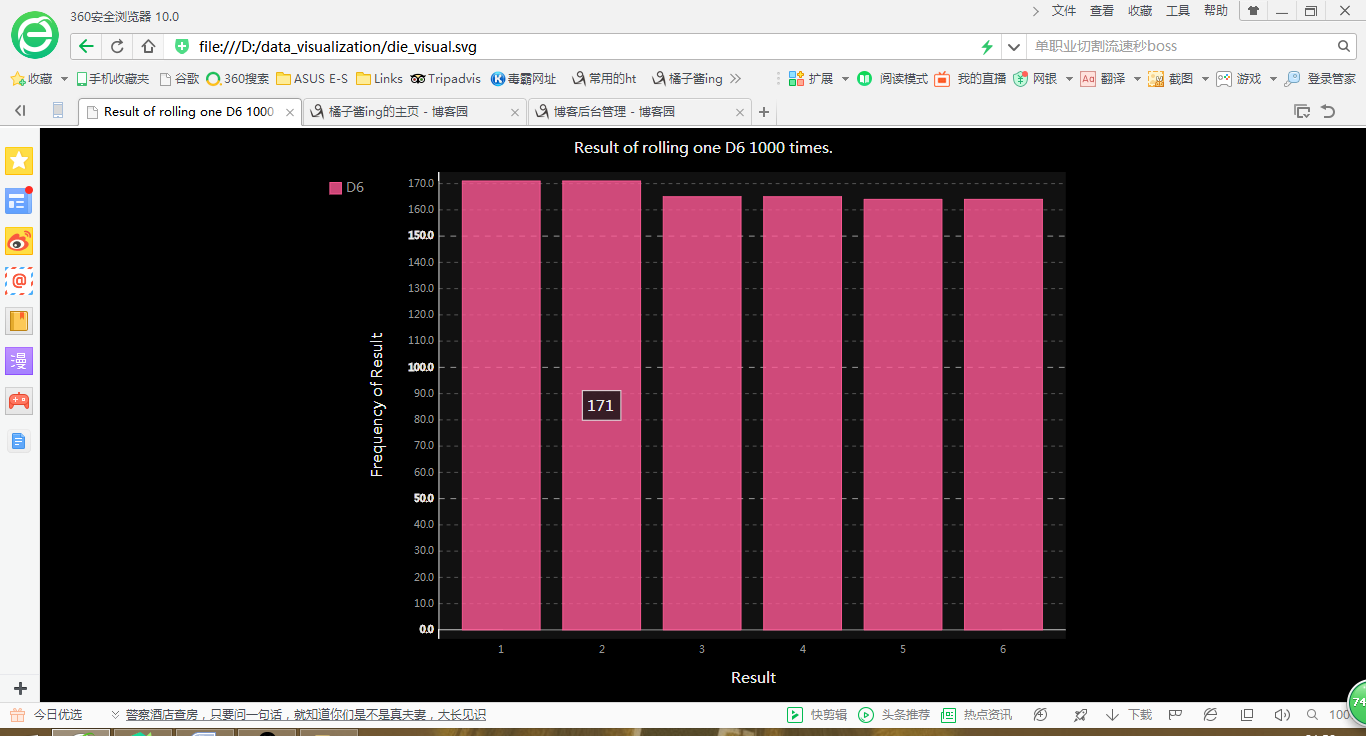
Pygal让这个图标具有交互性:如果你将鼠标指向该图表中的任何条形,将看到与之相关联的数据。
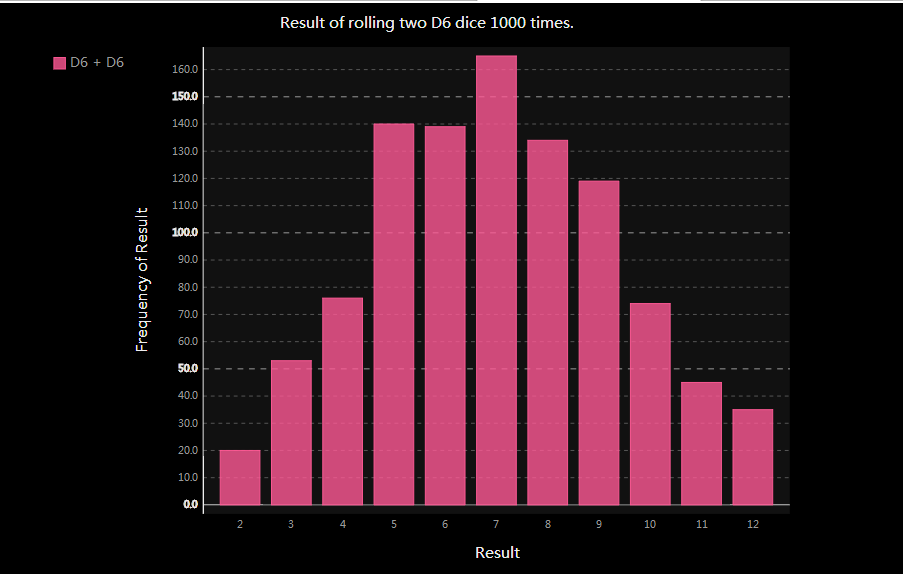
15.4.7 同时掷两个骰子
from die import Die
import pygal
# 创建两个D6
die_1 = Die()
die_2 = Die()

# 掷几次骰子,并将结果存储在一个列表中
results = []
for roll_num in range(1000):
    result = die_1.roll() + die_2.roll()
    results.append(result)

# 分析结果
frequencies = []
max_result = die_1.num_sides +die_2.num_sides
for value in range(2,max_result+1):
    frequency = results.count(value)
    frequencies.append(frequency)

# 对结果进行可视化
hist = pygal.Bar()

hist.title = "Result of rolling two D6 dice 1000 times."
hist.x_labels = ['2','3','4','5','6','7','8','9','10','11','12']
hist.x_title = "Result"
hist.y_title = "Frequency of Result"

hist.add('D6 + D6',frequencies)
hist.render_to_file('die_visual.svg')
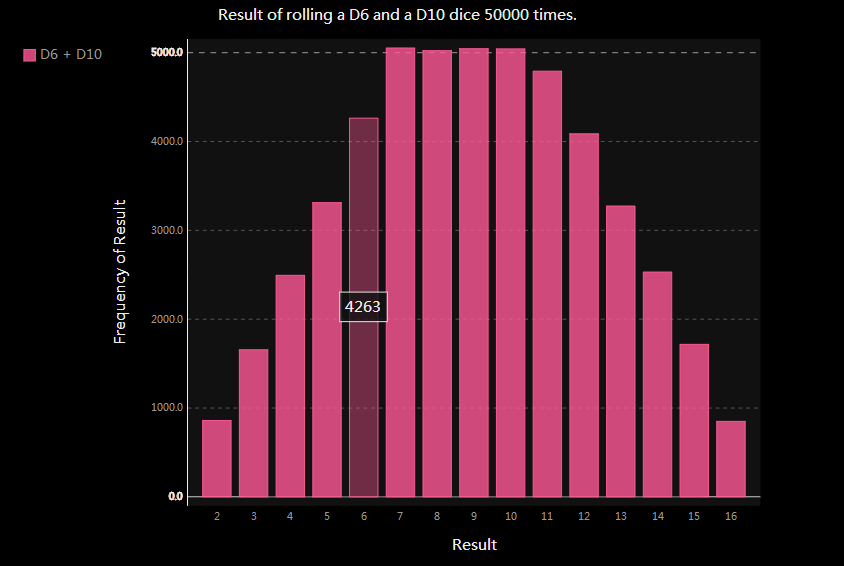
15.4.8 同时掷两个面数不同的骰子
from die import Die
import pygal
# 创建一个D6和一个D10
die_1 = Die()
die_2 = Die(10)

# 掷几次骰子,并将结果存储在一个列表中
results = []
for roll_num in range(50000):
    result = die_1.roll() + die_2.roll()
    results.append(result)

# 分析结果
frequencies = []
max_result = die_1.num_sides +die_2.num_sides
for value in range(2,max_result+1):
    frequency = results.count(value)
    frequencies.append(frequency)

# 对结果进行可视化
hist = pygal.Bar()

hist.title = "Result of rolling a D6 and a D10 dice 50000 times."
hist.x_labels = ['2','3','4','5','6','7','8','9','10','11','12','13','14','15','16']
hist.x_title = "Result"
hist.y_title = "Frequency of Result"

hist.add('D6 + D10',frequencies)
hist.render_to_file('die_visual.svg')