matplot 画图示例
Example1
from matplotlib import pylab as plt
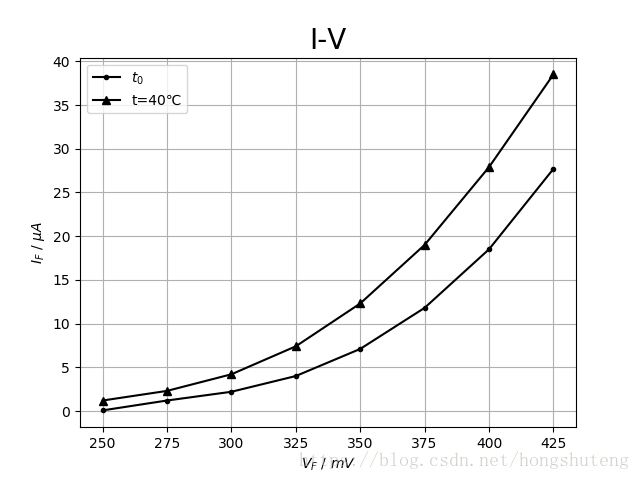
V1=range(250,450,25)
I11=[0.07,1.2,2.2,4.0,7.1,11.8,18.5,27.7]
I12=[1.2,2.3,4.2,7.4,12.3,19.0,27.9,38.5]
t=range(40,90,5)
V2=[452,442,432,421,411,400,388,376,360,348]
plt.figure(1)
plt.plot(V1,I11,'-k.',label=r'$t_0$')
plt.plot(V1,I12,'-k^',label='t=40'+u'\u2103')
plt.title('I-V',fontsize='20')
plt.xlabel(r'$V_F$'+' / '+r'$mV$')
plt.ylabel(r'$I_F$'+' / '+ r'$\mu A$')
plt.legend(loc='upper left')
plt.grid('on')
plt.figure(2)
plt.plot(t,V2,'-k.')
plt.title('V-t',fontsize="20")
plt.xlabel(r'$t / $'+u'\u2103')
plt.ylabel(r'$V_F / mV$')
plt.grid('on')
plt.show()
NewV2=np.polyfit(t,V2,1)
LinearV2=np.poly1d(z1)
print(LinearV2)