Hystrix-Dashboard是一款监视Hystrix状态的一款工具,能够显示出熔断时间,响应速度等信息,只能显示一个应用的信息,如果想查看整个系统中多个服务的数据,就需要使用工具Turbine.
(一).配置Hystrix-Dashboard(在上一篇熔断的基础上进行改造)
1.添加依赖
<dependency>
    <groupId>org.springframework.cloud</groupId>
    <artifactId>spring-cloud-starter-hystrix</artifactId>
</dependency>
<dependency>
    <groupId>org.springframework.cloud</groupId>
    <artifactId>spring-cloud-starter-hystrix-dashboard</artifactId>
</dependency>
<dependency>
    <groupId>org.springframework.boot</groupId>
    <artifactId>spring-boot-starter-actuator</artifactId>
</dependency>
2.配置文件
3.启动类上添加@EnableHystrixDashboard和@EnableCircuitBreaker注解
4.输入http://localhost:9015/hystrix,会显示如下的界面:
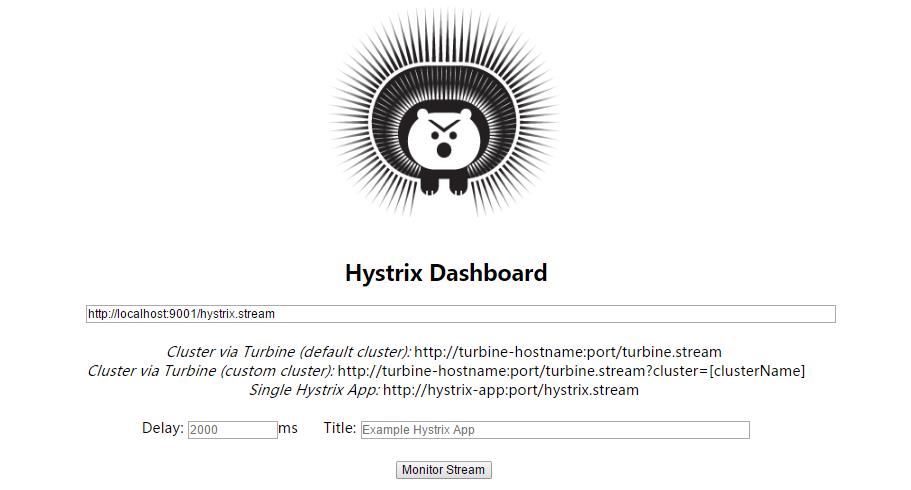
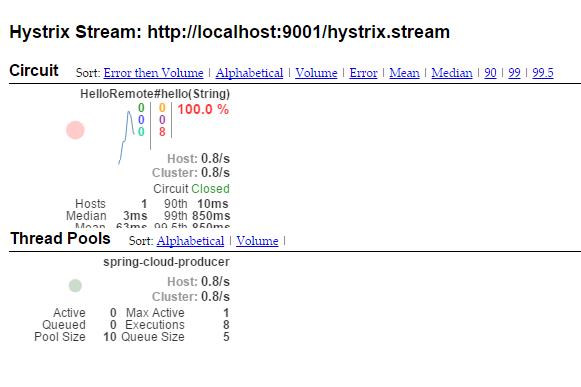
文中的意思:查看默认集群使用第一项的地址格式,查看指定的集群使用第二个格式,参数中会指定cluster集群的名称,第三个是单独的应用,输入 http://localhost:9015/hystrix.stream,点击Monitor Stream,会一直显示Loading,Customer发起一个接口请求时,会看到如下图所示:
扫描二维码关注公众号,回复:
7285763 查看本文章

(二).配置Turbine
1.添加依赖
<dependency>
        <groupId>org.springframework.cloud</groupId>
        <artifactId>spring-cloud-starter-turbine</artifactId>
    </dependency>
    <dependency>
        <groupId>org.springframework.cloud</groupId>
        <artifactId>spring-cloud-netflix-turbine</artifactId>
    </dependency>
    <dependency>
        <groupId>org.springframework.boot</groupId>
        <artifactId>spring-boot-starter-actuator</artifactId>
    </dependency>
    <dependency>
        <groupId>org.springframework.cloud</groupId>
        <artifactId>spring-cloud-starter-hystrix-dashboard</artifactId>
</dependency>
2.修改配置文件
spring.application.name=hystrix-dashboard-turbine
server.port=8001
turbine.appConfig=node01,node02
turbine.aggregator.clusterConfig= default
turbine.clusterNameExpression= new String("default")
eureka.client.serviceUrl.defaultZone=http://localhost:8000/eureka/
其中