#coding:utf-8
'''
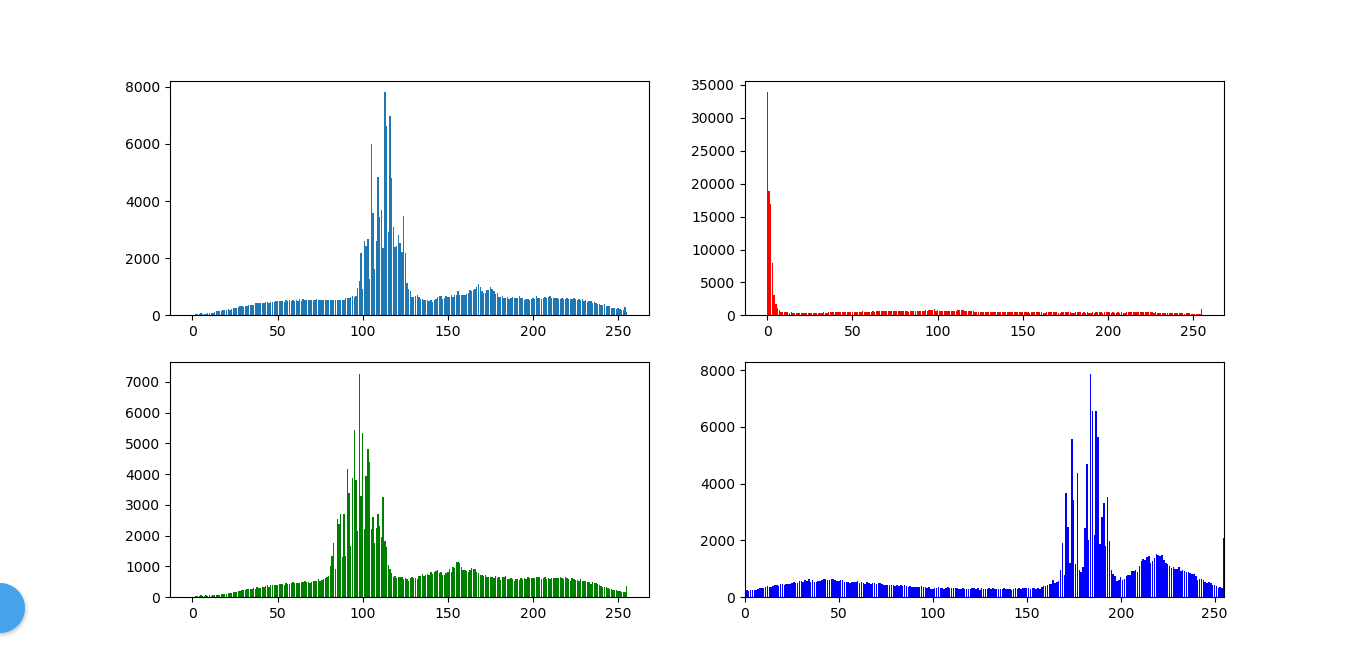
直方图
'''
import cv2
import numpy as np
import matplotlib.pyplot as plt
'''
计算RGB图像每个通道的直方图
'''
def cal_histgram_rgb(image):
image_rgb = cv2.cvtColor(image,cv2.COLOR_BGR2RGB)
channel_r,channel_g,channel_b = cv2.split(image_rgb)
r_hist = np.zeros((256,),np.int32).tolist()
g_hist = np.zeros((256,),np.int32).tolist()
b_hist = np.zeros((256,),np.int32).tolist()
rows,cols,_ = image.shape
for y in range(rows):
for x in range(cols):
r_hist[channel_r[y,x]] += 1
g_hist[channel_g[y,x]] += 1
b_hist[channel_b[y,x]] += 1
return r_hist,g_hist,b_hist
def cal_hist_gray(image):
gray = cv2.cvtColor(image,cv2.COLOR_RGB2GRAY)
rows,cols = gray.shape
hist_data = np.zeros((256,),np.int32).tolist()
for y in range(rows):
for x in range(cols):
hist_data[gray[y,x]] += 1
return hist_data
image = cv2.imread('datas/l1.jpg')
hist_r,hist_g,hist_b = cal_histgram_rgb(image)
hist_data = cal_hist_gray(image)
# 坐标
x = np.arange(0,256)
_, axarr = plt.subplots(2,2)
plt.xlim(0,255)
axarr[0,0].bar(x,hist_data)
axarr[0,1].bar(x,hist_r,color='r')
axarr[1,0].bar(x,hist_g,color='g')
axarr[1,1].bar(x,hist_b,color='b')
plt.show()