在matlab中,经常遇到画图问题,甚至,有时候需要把其他软件中的数据,导出来,用matlab处理。
此处给出,用matlab处理数据的一些简单方法。
1)matlab加载excel文件
首先,数据在excel中,需要是一列表的形式,不存在无关的数据。
代码为:
- clc;
- close all;
- clear all;
- file = ‘E:\matlabtest\1.xls’;
- data = xlsread(file);
- y = data(:,2);
- plot(x,y);
clc;
close all;
clear all;
file = 'E:\matlabtest\1.xls';
data = xlsread(file);
y = data(:,2);
plot(x,y);
系统中需要安装excel。
2)一次画多个曲线
- clc;
- close all;
- clear all;
- file = ‘E:\matlabtest\1.xls’;
- data = xlsread(file);
- x = data(:,1);
- y = data(:,2);
- plot(x,y);
- hold on;
- file = ‘E:\matlabtest\2.xls’;
- data = xlsread(file);
- x = data(:,1);
- y = data(:,2);
- plot(x,y);
clc;
close all;
clear all;
file = 'E:\matlabtest\1.xls';
data = xlsread(file);
x = data(:,1);
y = data(:,2);
plot(x,y);
hold on;
file = 'E:\matlabtest\2.xls';
data = xlsread(file);
x = data(:,1);
y = data(:,2);
plot(x,y);
简单而言,就是在上次绘图完成之后,加入hold on;然后进行第二次绘图。当需要结束本图的绘制,进入下一副的绘制,加入代码hold off;即可。
3)关于绘图的图例,线型,可以参考网上资料。此处给出简单说明。
y 黄 - 实线 . 点 < 小于号
m 紫 : 点线 o 圆 s 正方形
c 青 -. 点划线 x 叉号 d 菱形
r 红 - - 虚线 + 加号 h 六角星
g 绿 * 星号 p 五角星
b 蓝 v 向下三角形
w 白 ^ 向上三角形
k 黑 > 大于号
例如,输入,然后查看图形形状:
- >> plot(x,y1,’r+-‘,x,y2,’k*:’)
>> plot(x,y1,'r+-',x,y2,'k*:')
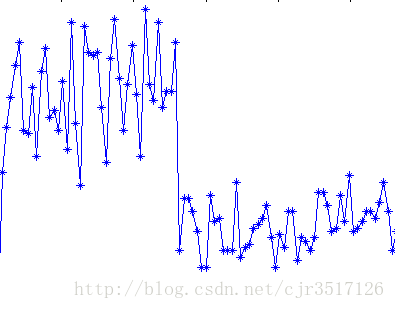
- plot(x,y,’-*’);
plot(x,y,'-*');
扫描二维码关注公众号,回复:
769510 查看本文章

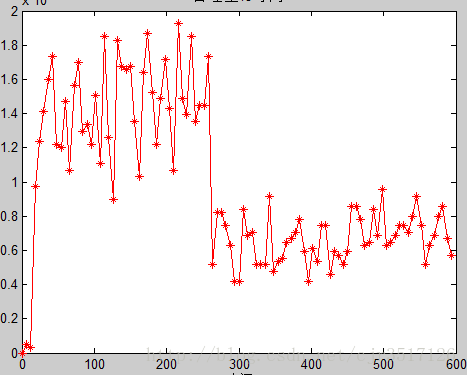
- plot(x,y,’r-*’);
plot(x,y,'r-*');
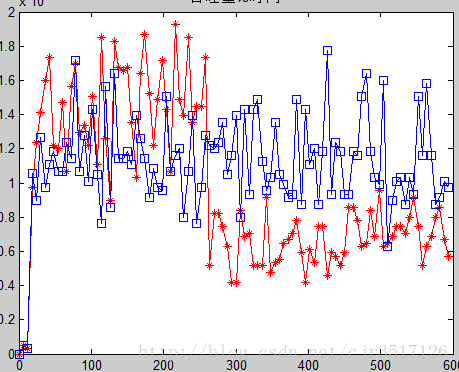
- plot(x,y,’r-*’);
- plot(x,y,’b-s’);
plot(x,y,'r-*');
plot(x,y,'b-s');
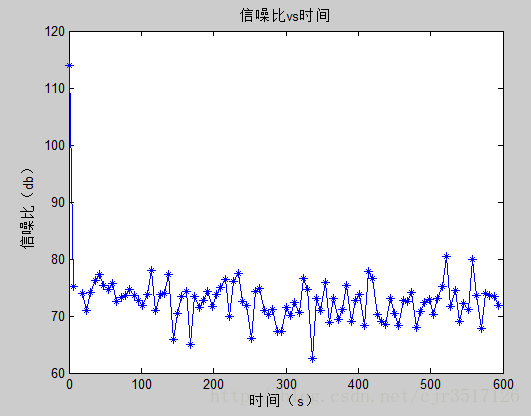
4)添加标签,图例,坐标,标题等
- xlabel(‘时间’);
- ylabel(‘吞吐量’);
- title(‘吞吐量vs时间’);
xlabel('时间');
ylabel('吞吐量');
title('吞吐量vs时间');
在matlab中,经常遇到画图问题,甚至,有时候需要把其他软件中的数据,导出来,用matlab处理。
此处给出,用matlab处理数据的一些简单方法。
1)matlab加载excel文件
首先,数据在excel中,需要是一列表的形式,不存在无关的数据。
代码为:
- clc;
- close all;
- clear all;
- file = ‘E:\matlabtest\1.xls’;
- data = xlsread(file);
- y = data(:,2);
- plot(x,y);
clc;
close all;
clear all;
file = 'E:\matlabtest\1.xls';
data = xlsread(file);
y = data(:,2);
plot(x,y);
系统中需要安装excel。
2)一次画多个曲线
- clc;
- close all;
- clear all;
- file = ‘E:\matlabtest\1.xls’;
- data = xlsread(file);
- x = data(:,1);
- y = data(:,2);
- plot(x,y);
- hold on;
- file = ‘E:\matlabtest\2.xls’;
- data = xlsread(file);
- x = data(:,1);
- y = data(:,2);
- plot(x,y);
clc;
close all;
clear all;
file = 'E:\matlabtest\1.xls';
data = xlsread(file);
x = data(:,1);
y = data(:,2);
plot(x,y);
hold on;
file = 'E:\matlabtest\2.xls';
data = xlsread(file);
x = data(:,1);
y = data(:,2);
plot(x,y);
简单而言,就是在上次绘图完成之后,加入hold on;然后进行第二次绘图。当需要结束本图的绘制,进入下一副的绘制,加入代码hold off;即可。
3)关于绘图的图例,线型,可以参考网上资料。此处给出简单说明。
y 黄 - 实线 . 点 < 小于号
m 紫 : 点线 o 圆 s 正方形
c 青 -. 点划线 x 叉号 d 菱形
r 红 - - 虚线 + 加号 h 六角星
g 绿 * 星号 p 五角星
b 蓝 v 向下三角形
w 白 ^ 向上三角形
k 黑 > 大于号
例如,输入,然后查看图形形状:
- >> plot(x,y1,’r+-‘,x,y2,’k*:’)
>> plot(x,y1,'r+-',x,y2,'k*:')
- plot(x,y,’-*’);
plot(x,y,'-*');
- plot(x,y,’r-*’);
plot(x,y,'r-*');
- plot(x,y,’r-*’);
- plot(x,y,’b-s’);
plot(x,y,'r-*');
plot(x,y,'b-s');
4)添加标签,图例,坐标,标题等
- xlabel(‘时间’);
- ylabel(‘吞吐量’);
- title(‘吞吐量vs时间’);
xlabel('时间');
ylabel('吞吐量');
title('吞吐量vs时间');