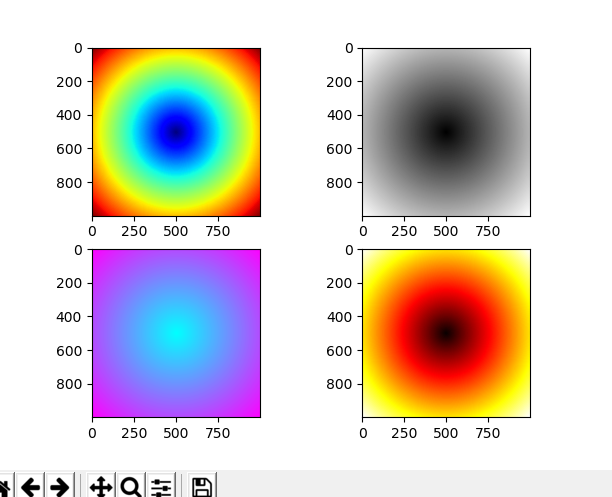
热图(heatmap)通过色差、亮度来展示数据的差异。
在 Python 的 Matplotlib 库中,调用imshow()函数绘制热图。
示例:
import numpy as np
import matplotlib.pyplot as plt

points = np.arange(-5,5,0.01)

x,y = np.meshgrid(points,points) z = np.sqrt(x**2 + y**2) cmaps = [plt.cm.jet, plt.cm.gray, plt.cm.cool, plt.cm.hot] fig, axes = plt.subplots(2, 2) for i, ax in enumerate(axes.ravel()): ax.imshow(z,cmap=cmaps[i]) plt.show()