d3-弦图
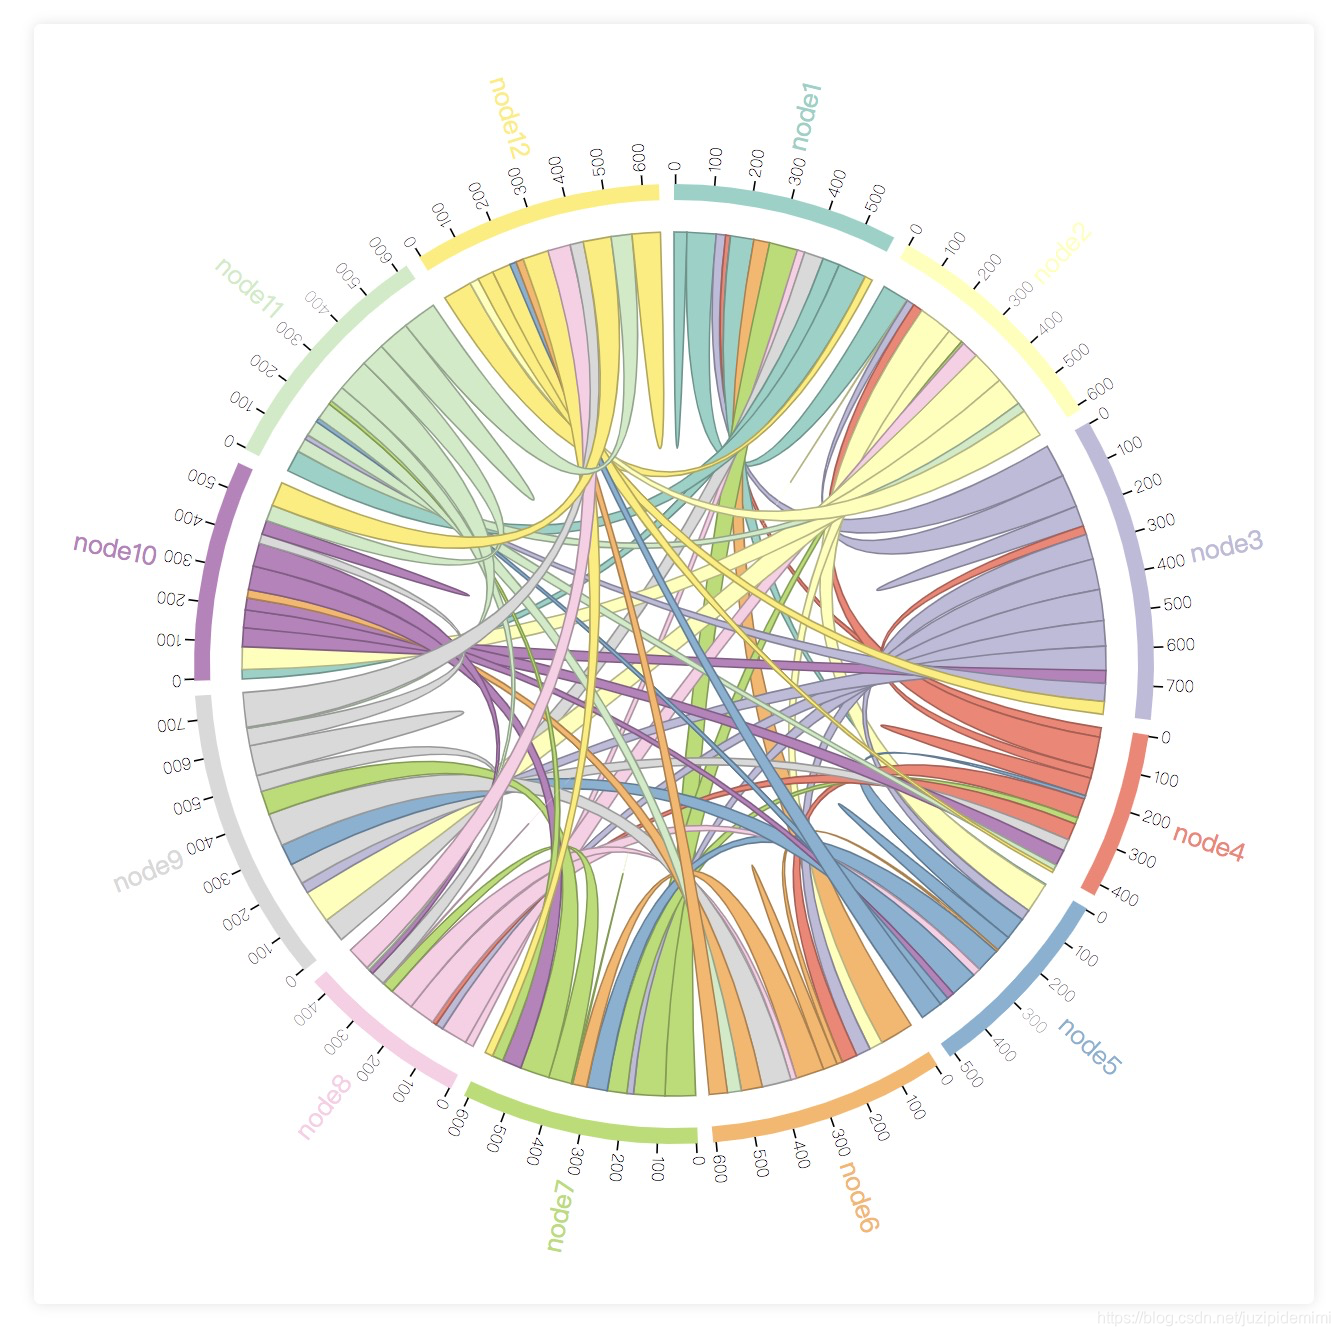
弦图主要用来展示节点之间的联系。主要包含两部分,节点部分和表示节点联系的弦部分,弦的粗细表示比重。
使用场景:
1.城市之间的人口流动比例。
2.一群人的邮件交流比例。
…
画一个弦图,首先需要一个矩阵数据matrix,以二位数组表示,数组每一项都是一个节点,而matrix[i][j]表示第i个节点到第j个节点的流量。
const matrix = [
    [ 10,  20 , 20 , 30 , 40 ], // 节点1
    [ 5,  15 , 55 , 10  , 10 ], // 节点2
    [ 20,  5 , 80 , 5 , 5  ], // ...
    [ 10,  20 , 20 , 30 , 40 ],
]
然后使用d3.chord处理数据
const chords = d3.chord()
    (matrix)
返回值是一组chords,表示一对节点间的流量,包含两个属性:
- source:弦的源节点对象
- target:弦的目标节点对象
source和target对象都包含下列的属性:
- startAngle 起始角度
- endAngle 终止角度
- index 索引i
- subindex 索引j
- value
matrix[i][j]的值
然后使用d3.ibbon来绘制所有的弦:
	const colors = d3.schemeSet3
    function drawChords() {
        const ribbon = d3.ribbon()
            .radius(200)

        svg.append('g')
            .attr('class', 'chord')
            .selectAll('path')
            .data(chords)
            .enter()
            .append('path')
            .attr('d', ribbon)
            .attr('fill', ({ source: { index } }) => colors[index])
            .attr('stroke', ({ source: { index } }) => d3.rgb(colors[index]).darker())
            .on('mouseover', function ({ source: { index } }, i) {
                d3.select(this)
                    .attr('fill', d3.rgb(colors[index]).darker())
            })
            .on('mouseout', function ({ source: { index } }) {
                d3.select(this)
                    .attr('fill', colors[index])
            })
    }
接着绘制所有的节点,节点的数据在chords.groups,包含以下属性:
- startAngle 其实角度
- endAngle 终止角度
- value 值
- index 索引
我们可以使用饼图生成器进行绘制:
function drawGroups() {
    const groups = chords.groups // 节点数组

    const arc = d3.arc()
        .innerRadius(210)
        .outerRadius(230)

    svg.append('g')
        .attr('class', 'groups')
        .selectAll('g')
        .data(groups)
        .enter()
        .append('g')
        .attr('class', 'group')
        .append('path')
        .attr('d', d => {
            return arc(d)
        })
        .attr('fill', (_, i) => colors[i])
}
另外你还可以设置节点之间间隙、节点和弦之间的排序规则等,具体参考官方api。
demo:live demo
完整源码地址:https://github.com/shenyiling/d3-demos/blob/master/chord-chart.html
