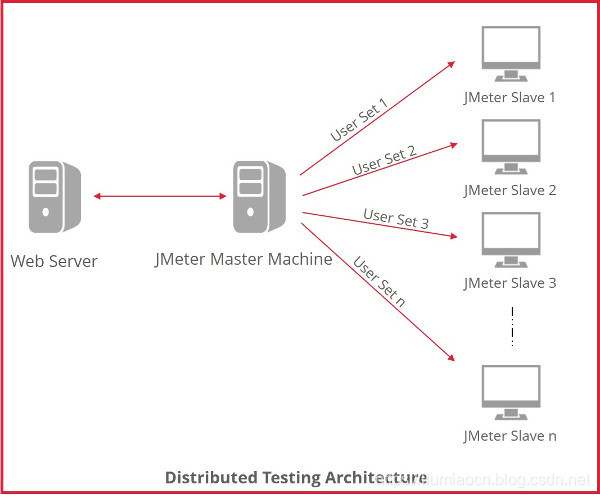
Apache JMeter是一个纯Java开发的用于负载测试或者性能测试的开源软件。在前面的文章中介绍了JMeter搭建分布式测试环境和使用的方法,但是在演示中一主多从的压测环境构成之后,是通过页面的的方式进行指定的,这篇文章结合具体的示例来介绍一下如何使用命令行来动态的指定节点,因为在集成JMeter的能力的时候,这种手工的操作需要使用自动的方式来替代,而命令行中就直接提供了选项予以支撑。
事前准备
JMeter分布式压测环境准备
详细环境构建方法参看如下内容:
- https://blog.csdn.net/liumiaocn/article/details/101638943
结果确认
启动命令:jmeter -Djava.rmi.server.hostname=机器名或者IP地址 -Dserver_port=端口号 -s -j 日志文件名称
事前的准备只需要启动三个待用的JMeter的Slave节点即可,启动之后会有三个JMeter进程待用
liumiaocn:apache-jmeter-5.1.1 liumiao$ ps -ef |grep jmeter |grep -v grep
  501 17284 16769   0  6:47AM ttys001    0:00.01 /bin/sh bin/jmeter -Djava.rmi.server.hostname=192.168.31.242 -Dserver_port=31099 -s -j /tmp/jmeter-slave-1.log
  501 17291 17284   0  6:47AM ttys001    0:01.52 /Library/Java/JavaVirtualMachines/jdk1.8.0_191.jdk/Contents/Home/bin/java -server -XX:+HeapDumpOnOutOfMemoryError -Xms1g -Xmx1g -XX:MaxMetaspaceSize=256m -XX:+UseG1GC -XX:MaxGCPauseMillis=100 -XX:G1ReservePercent=20 -Djava.security.egd=file:/dev/urandom -Duser.language=en -Duser.region=EN -Xdock:name=JMeter -Xdock:icon="bin/../docs/images/jmeter_square.png" -Dapple.laf.useScreenMenuBar=true -Dapple.eawt.quitStrategy=CLOSE_ALL_WINDOWS -jar bin/ApacheJMeter.jar -Djava.rmi.server.hostname=192.168.31.242 -Dserver_port=31099 -s -j /tmp/jmeter-slave-1.log
  501 17292 16939   0  6:47AM ttys002    0:00.01 /bin/sh bin/jmeter -Djava.rmi.server.hostname=192.168.31.242 -Dserver_port=31020 -s -j /tmp/jmeter-slave-2.log
  501 17299 17292   0  6:47AM ttys002    0:01.55 /Library/Java/JavaVirtualMachines/jdk1.8.0_191.jdk/Contents/Home/bin/java -server -XX:+HeapDumpOnOutOfMemoryError -Xms1g -Xmx1g -XX:MaxMetaspaceSize=256m -XX:+UseG1GC -XX:MaxGCPauseMillis=100 -XX:G1ReservePercent=20 -Djava.security.egd=file:/dev/urandom -Duser.language=en -Duser.region=EN -Xdock:name=JMeter -Xdock:icon="bin/../docs/images/jmeter_square.png" -Dapple.laf.useScreenMenuBar=true -Dapple.eawt.quitStrategy=CLOSE_ALL_WINDOWS -jar bin/ApacheJMeter.jar -Djava.rmi.server.hostname=192.168.31.242 -Dserver_port=31020 -s -j /tmp/jmeter-slave-2.log
  501 17300 17108   0  6:47AM ttys003    0:00.01 /bin/sh bin/jmeter -Djava.rmi.server.hostname=192.168.31.242 -Dserver_port=31021 -s -j /tmp/jmeter-slave-3.log
  501 17307 17300   0  6:47AM ttys003    0:01.54 /Library/Java/JavaVirtualMachines/jdk1.8.0_191.jdk/Contents/Home/bin/java -server -XX:+HeapDumpOnOutOfMemoryError -Xms1g -Xmx1g -XX:MaxMetaspaceSize=256m -XX:+UseG1GC -XX:MaxGCPauseMillis=100 -XX:G1ReservePercent=20 -Djava.security.egd=file:/dev/urandom -Duser.language=en -Duser.region=EN -Xdock:name=JMeter -Xdock:icon="bin/../docs/images/jmeter_square.png" -Dapple.laf.useScreenMenuBar=true -Dapple.eawt.quitStrategy=CLOSE_ALL_WINDOWS -jar bin/ApacheJMeter.jar -Djava.rmi.server.hostname=192.168.31.242 -Dserver_port=31021 -s -j /tmp/jmeter-slave-3.log
liumiaocn:apache-jmeter-5.1.1 liumiao$
- 1
- 2
- 3
- 4
- 5
- 6
- 7
- 8
压测应用准备(nginx服务)
压测应用:
http://192.168.31.242:8088/
在本地机器的8088端口使用Docker启动一个Nginx应用(使用其他方式也可),示例如下所示:
liumiaocn:~ liumiao$ docker images |grep nginx |grep latest
nginx                                           latest                          e445ab08b2be        2 months ago        126MB
liumiaocn:~ liumiao$ docker run -p 8088:80 -d --name=nginx-test nginx:latest
a80fb1a4fc20627891a6bd7394fd79ae9aefb7dc8cf72c12967bc2673a815308
liumiaocn:~ liumiao$
- 1
- 2
- 3
- 4
- 5
使用curl命令或者直接使用浏览器确认nginx已正常运行
liumiaocn:~ liumiao$ curl http://localhost:8088/
<!DOCTYPE html>
<html>
<head>
<title>Welcome to nginx!</title>
<style>
    body {
        width: 35em;
        margin: 0 auto;
        font-family: Tahoma, Verdana, Arial, sans-serif;
    }
</style>
</head>
<body>
<h1>Welcome to nginx!</h1>
<p>If you see this page, the nginx web server is successfully installed and
working. Further configuration is required.</p>

<p>For online documentation and support please refer to
<a href="http://nginx.org/">nginx.org</a>.<br/>
Commercial support is available at
<a href="http://nginx.com/">nginx.com</a>.</p>

<p><em>Thank you for using nginx.</em></p>
</body>
</html>
liumiaocn:~ liumiao$
- 1
- 2
- 3
- 4
- 5
- 6
- 7
- 8
- 9
- 10
- 11
- 12
- 13
- 14
- 15
- 16
- 17
- 18
- 19
- 20
- 21
- 22
- 23
- 24
- 25
- 26
- 27
压测内容准备(jmx文件)
压测内容:
使用100个线程组 * 10循环 进行共计1000次执行http://192.168.31.242:8088/ 的http的get方法的压力测试。
为了完成上述的压测内容,相关的jmx文件内容如下所示
liumiaocn:apache-jmeter-5.1.1 liumiao$ cat /tmp/data/jmeter-nongui-test.jmx
<?xml version="1.0" encoding="UTF-8"?>
<jmeterTestPlan version="1.2" properties="5.0" jmeter="5.1.1 r1855137">
  <hashTree>
    <TestPlan guiclass="TestPlanGui" testclass="TestPlan" testname="测试计划" enabled="true">
      <stringProp name="TestPlan.comments"></stringProp>
      <boolProp name="TestPlan.functional_mode">false</boolProp>
      <boolProp name="TestPlan.tearDown_on_shutdown">true</boolProp>
      <boolProp name="TestPlan.serialize_threadgroups">false</boolProp>
      <elementProp name="TestPlan.user_defined_variables" elementType="Arguments" guiclass="ArgumentsPanel" testclass="Arguments" testname="用户定义的变量" enabled="true">
        <collectionProp name="Arguments.arguments"/>
      </elementProp>
      <stringProp name="TestPlan.user_define_classpath"></stringProp>
    </TestPlan>
    <hashTree>
      <ThreadGroup guiclass="ThreadGroupGui" testclass="ThreadGroup" testname="线程组" enabled="true">
        <stringProp name="ThreadGroup.on_sample_error">continue</stringProp>
        <elementProp name="ThreadGroup.main_controller" elementType="LoopController" guiclass="LoopControlPanel" testclass="LoopController" testname="循环控制器" enabled="true">
          <boolProp name="LoopController.continue_forever">false</boolProp>
          <stringProp name="LoopController.loops">10</stringProp>
        </elementProp>
        <stringProp name="ThreadGroup.num_threads">100</stringProp>
        <stringProp name="ThreadGroup.ramp_time">1</stringProp>
        <boolProp name="ThreadGroup.scheduler">false</boolProp>
        <stringProp name="ThreadGroup.duration"></stringProp>
        <stringProp name="ThreadGroup.delay"></stringProp>
      </ThreadGroup>
      <hashTree>
        <HTTPSamplerProxy guiclass="HttpTestSampleGui" testclass="HTTPSamplerProxy" testname="HTTP请求" enabled="true">
          <elementProp name="HTTPsampler.Arguments" elementType="Arguments" guiclass="HTTPArgumentsPanel" testclass="Arguments" testname="用户定义的变量" enabled="true">
            <collectionProp name="Arguments.arguments"/>
          </elementProp>
          <stringProp name="HTTPSampler.domain">192.168.31.242</stringProp>
          <stringProp name="HTTPSampler.port">8088</stringProp>
          <stringProp name="HTTPSampler.protocol">http</stringProp>
          <stringProp name="HTTPSampler.contentEncoding"></stringProp>
          <stringProp name="HTTPSampler.path">/</stringProp>
          <stringProp name="HTTPSampler.method">GET</stringProp>
          <boolProp name="HTTPSampler.follow_redirects">true</boolProp>
          <boolProp name="HTTPSampler.auto_redirects">false</boolProp>
          <boolProp name="HTTPSampler.use_keepalive">true</boolProp>
          <boolProp name="HTTPSampler.DO_MULTIPART_POST">false</boolProp>
          <stringProp name="HTTPSampler.embedded_url_re"></stringProp>
          <stringProp name="HTTPSampler.connect_timeout"></stringProp>
          <stringProp name="HTTPSampler.response_timeout"></stringProp>
        </HTTPSamplerProxy>
        <hashTree/>
      </hashTree>
    </hashTree>
  </hashTree>
</jmeterTestPlan>
liumiaocn:apache-jmeter-5.1.1 liumiao$
- 1
- 2
- 3
- 4
- 5
- 6
- 7
- 8
- 9
- 10
- 11
- 12
- 13
- 14
- 15
- 16
- 17
- 18
- 19
- 20
- 21
- 22
- 23
- 24
- 25
- 26
- 27
- 28
- 29
- 30
- 31
- 32
- 33
- 34
- 35
- 36
- 37
- 38
- 39
- 40
- 41
- 42
- 43
- 44
- 45
- 46
- 47
- 48
- 49
- 50
- 51
- 52
指定Slave节点执行压测
使用-R即可指定Slave节点执行压测,具体命令如下所示:

执行命令:jmeter -n -t jmx文件 -R Slave节点IP:端口号 -l 结果文件 -j 日志信息
指定Slave节点-2执行压测内容
liumiaocn:apache-jmeter-5.1.1 liumiao$ bin/jmeter -n -t /tmp/data/jmeter-nongui-test.jmx -R 192.168.31.242:31020 -l /tmp/jmeter-result.jtl -j /tmp/jmeter-test.log
Creating summariser <summary>
Created the tree successfully using /tmp/data/jmeter-nongui-test.jmx
Configuring remote engine: 192.168.31.242:31020
Starting remote engines
Starting the test @ Thu Oct 03 07:03:46 CST 2019 (1570057426968)
Remote engines have been started
Waiting for possible Shutdown/StopTestNow/HeapDump/ThreadDump message on port 4445
summary =   1000 in 00:00:01 =  850.3/s Avg:    23 Min:     2 Max:    71 Err:     0 (0.00%)
Tidying up remote @ Thu Oct 03 07:03:49 CST 2019 (1570057429128)
... end of run
liumiaocn:apache-jmeter-5.1.1 liumiao$
- 1
- 2
- 3
- 4
- 5
- 6
- 7
- 8
- 9
- 10
- 11
- 12
同时在Slave-2节点的终端上可以看到执行开始和结束的输出信息
liumiaocn:apache-jmeter-5.1.1 liumiao$ bin/jmeter -Djava.rmi.server.hostname=192.168.31.242 -Dserver_port=31020 -s -j /tmp/jmeter-slave-2.log
Created remote object: UnicastServerRef2 [liveRef: [endpoint:[192.168.31.242:61451](local),objID:[4cbbe152:16d8ea7fd55:-7fff, -5053050829591264010]]]
Starting the test on host 192.168.31.242:31020 @ Thu Oct 03 07:03:47 CST 2019 (1570057427648)
Finished the test on host 192.168.31.242:31020 @ Thu Oct 03 07:03:49 CST 2019 (1570057429128)
- 1
- 2
- 3
- 4
另外通过jtl文件也可以确认到这1000次执行的结果内容(1001是因为结果文件中有一行表头)
liumiaocn:apache-jmeter-5.1.1 liumiao$ wc -l  /tmp/jmeter-result.jtl
    1001 /tmp/jmeter-result.jtl
liumiaocn:apache-jmeter-5.1.1 liumiao$
- 1
- 2
- 3
指定Slave节点-3执行压测内容
liumiaocn:apache-jmeter-5.1.1 liumiao$ bin/jmeter -n -t /tmp/data/jmeter-nongui-test.jmx -R 192.168.31.242:31021 -l /tmp/jmeter-result.jtl -j /tmp/jmeter-test.log

Creating summariser <summary>
Created the tree successfully using /tmp/data/jmeter-nongui-test.jmx
Configuring remote engine: 192.168.31.242:31021
Starting remote engines
Starting the test @ Thu Oct 03 07:05:46 CST 2019 (1570057546255)
Remote engines have been started
Waiting for possible Shutdown/StopTestNow/HeapDump/ThreadDump message on port 4445
summary =   1000 in 00:00:01 =  854.7/s Avg:    25 Min:     2 Max:    86 Err:     0 (0.00%)
Tidying up remote @ Thu Oct 03 07:05:48 CST 2019 (1570057548344)
... end of run
liumiaocn:apache-jmeter-5.1.1 liumiao$
- 1
- 2
- 3
- 4
- 5
- 6
- 7
- 8
- 9
- 10
- 11
- 12
- 13
同时在Slave-3节点的终端上可以看到执行开始和结束的输出信息
liumiaocn:apache-jmeter-5.1.1 liumiao$ bin/jmeter -Djava.rmi.server.hostname=192.168.31.242 -Dserver_port=31021 -s -j /tmp/jmeter-slave-3.log
Created remote object: UnicastServerRef2 [liveRef: [endpoint:[192.168.31.242:61458](local),objID:[1f33aa8e:16d8ea81815:-7fff, 4753743365701930552]]]
Starting the test on host 192.168.31.242:31021 @ Thu Oct 03 07:05:46 CST 2019 (1570057546881)
Finished the test on host 192.168.31.242:31021 @ Thu Oct 03 07:05:48 CST 2019 (1570057548344)
- 1
- 2
- 3
- 4
另外通过jtl文件也可以确认到又增加了1000次执行。
liumiaocn:apache-jmeter-5.1.1 liumiao$ wc -l  /tmp/jmeter-result.jtl
    2001 /tmp/jmeter-result.jtl
liumiaocn:apache-jmeter-5.1.1 liumiao$
- 1
- 2
- 3
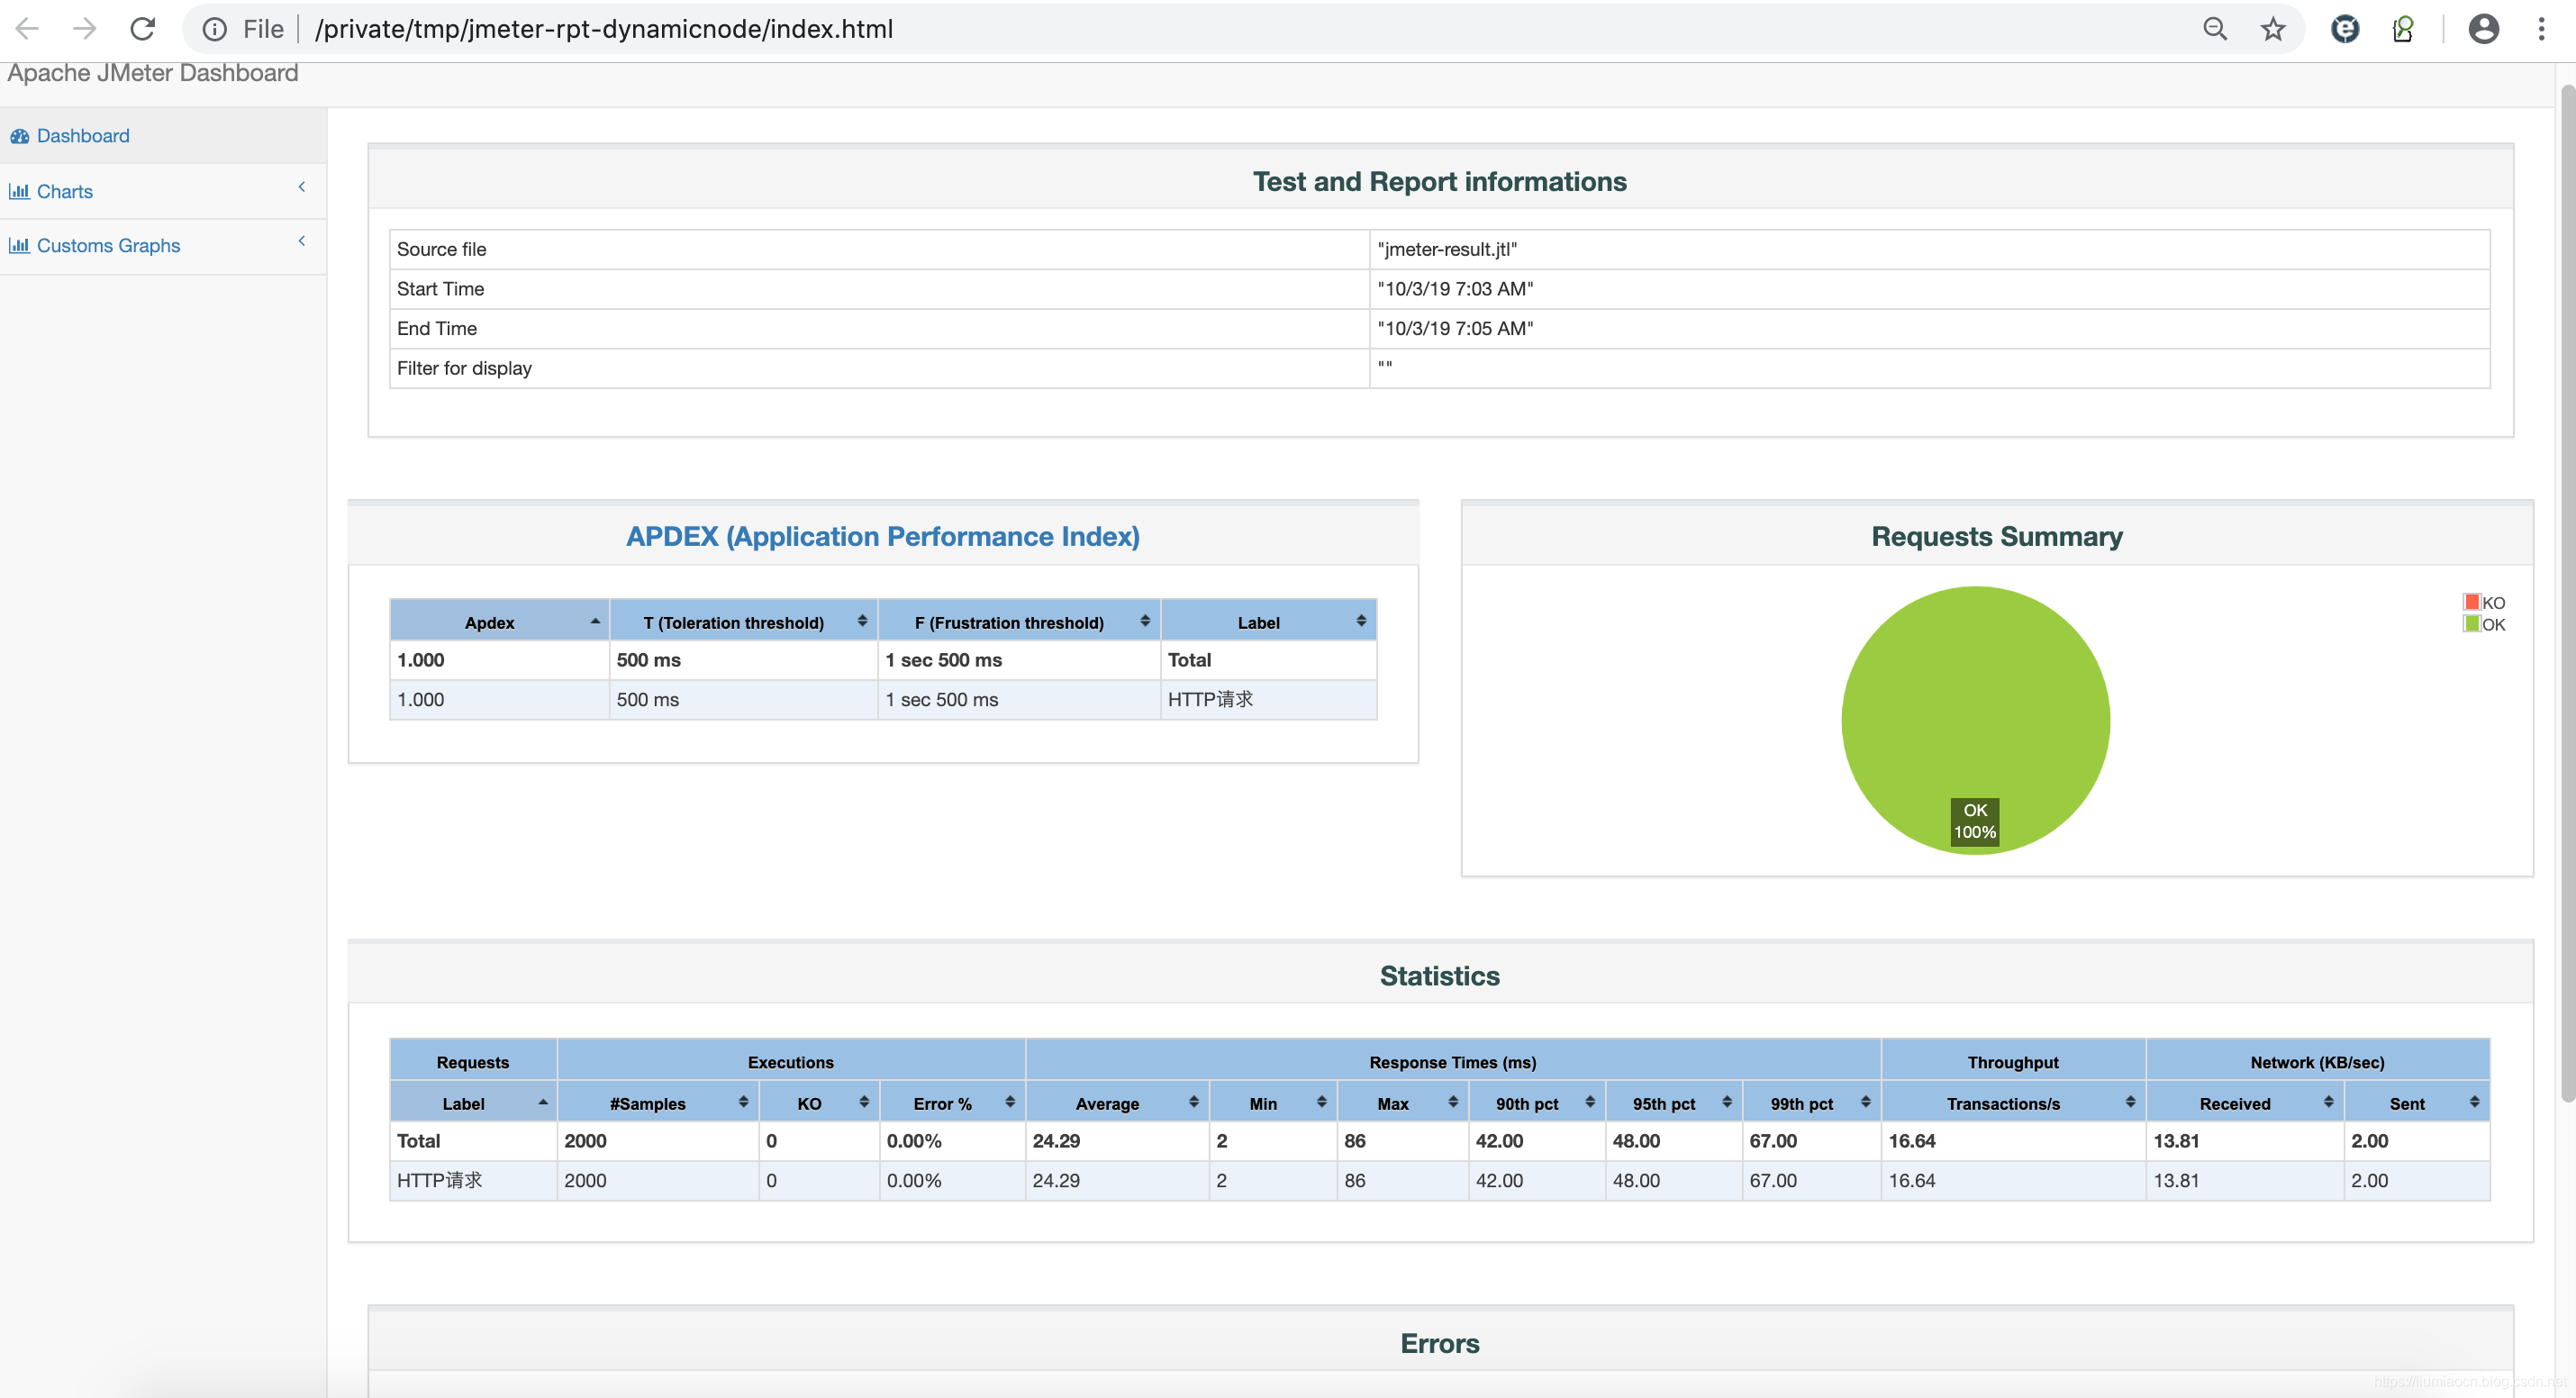
生成测试报告
使用上诉2000次执行结果文件生成压力测试报告
liumiaocn:apache-jmeter-5.1.1 liumiao$ bin/jmeter -g /tmp/jmeter-result.jtl -e -o /tmp/jmeter-rpt-dynamicnode -j /tmp/jmeter-rpt.log
liumiaocn:apache-jmeter-5.1.1 liumiao$
- 1
- 2
报告概要信息如下所示