自从使用python脚本后,经常用来调试数据的matlab终于有了一个简单易用的替代方案,相比matlab的.m语言,我更喜欢用python来解决。毕竟没有什么事情是不能python来解决的,如果没有我可以再加一个python来搞定。
首先,先亮图,这效果不比matlab差,是吧?
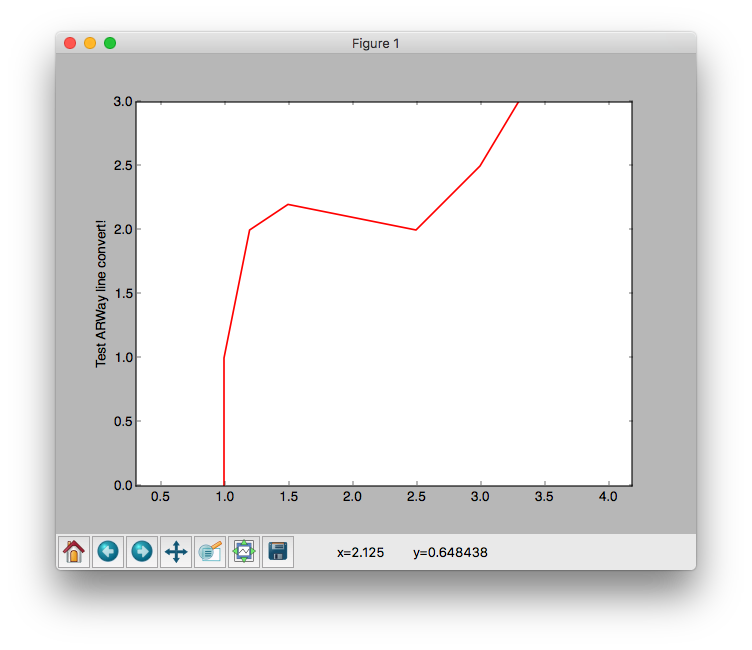
以下代码,来自于项目的工具代码,主要用来绘制log中的数据是否异常,因此直接使用log的输出数据:
11-18 20:45:15.540 23084-23150/hud.haliai.com.testarway E/HALO+testMovePath:  python origin path start
11-18 20:45:15.542 23084-23150/hud.haliai.com.testarway E/HALO+testMovePath:  python  1.0 , 0.0 ,0.0
11-18 20:45:15.543 23084-23150/hud.haliai.com.testarway E/HALO+testMovePath:  python  1.0 , 1.0 ,0.0
11-18 20:45:15.543 23084-23150/hud.haliai.com.testarway E/HALO+testMovePath:  python  1.2 , 2.0 ,0.0
11-18 20:45:15.544 23084-23150/hud.haliai.com.testarway E/HALO+testMovePath:  python  1.5 , 2.2 ,0.0
11-18 20:45:15.544 23084-23150/hud.haliai.com.testarway E/HALO+testMovePath:  python  2.5 , 2.0 ,0.0
11-18 20:45:15.544 23084-23150/hud.haliai.com.testarway E/HALO+testMovePath:  python  3.0 , 2.5 ,0.0
11-18 20:45:15.544 23084-23150/hud.haliai.com.testarway E/HALO+testMovePath:  python  3.3 , 3.0 ,0.0
将真保存于文件中,输入指令,满足的格式如下:
python draw_line.py data.txt python start end其中
data.txt 为数据文件
python 为split拆分tag的keyword
start 为起始行标记
end 为结束行标记
最后上python代码
import matplotlib.pyplot as plt
import os
import sys
import operator

def getFileVect3(path,filterTag=' ',startTag='start',endTag='end'):
    print [path,filterTag,startTag,endTag]
    lineFile = open(path).read().split('\n')
    print 'lineFile type is '+str(type(lineFile))
    oriStart = 0
    oriEnd = len(lineFile)
    number = 0
    for line in lineFile:
        if oriStart==0 and line.find(startTag)!=-1:
            oriStart=number
        elif line.find(endTag)!=-1:
            oriEnd=number
        number+=1
    oriPathX = []
    oriPathY = []
    oriPathZ = []
    indexs   = []
    for i in range(oriStart+1,oriEnd):
        raw=lineFile[i]
        # print 'raw type is '+str(type(raw))
        if operator.contains(raw,filterTag):
            line=raw.split(filterTag)
            if len(line) != 2:
                print 'line filter tag error !'
            head,content = line
            vect3=content.strip().split(',')
            if len(vect3) == 3:
                strX,strY,strZ = vect3
                oriPathX.append(float(strX))
                oriPathY.append(float(strY))
                oriPathZ.append(float(strZ))
                indexs.append(float(i))
                # print strX,strY,strZ
    return indexs,oriPathX,oriPathY,oriPathZ

# python draw_line.py data.txt split s_tag e_tag
if len(sys.argv) != 5:
    print 'bad para!'
    exit()
cmd,filename,split_tag,start_tag,end_tag=sys.argv
print [filename,split_tag,start_tag,end_tag]
i,x,y,z,=getFileVect3('./'+filename,split_tag,start_tag,end_tag)
plt.plot(x, y, 'r', label='line 1', linewidth=1.5)
plt.ylabel('Test ARWay line convert!')
plt.axis('equal')
plt.show()
