✌ Use of learning_curve function
1. ✌ Principle
This function is used to draw a learning curve. It can directly return training samples, training set scores, and test set scores. The
internal
learning curve is based on cross-validation to obtain scores. The learning curve is the accuracy of training set and cross-validation by drawing different training set sizes. , You can see the performance of the model on the new data, and then determine whether the variance of the model is too high or the deviation is too high, and whether increasing the training set can reduce overfitting.
2. ✌ Function form
sklearn.model_selection.learning_curve(estimator, X, y, groups=None, train_sizes=array([0.1, 0.33, 0.55, 0.78, 1. ]), cv=’warn’, scoring=None, exploit_incremental_learning=False, n_jobs=None, pre_dispatch=’all’, verbose=0, shuffle=False, random_state=None, error_score=’raise-deprecating’)
3. ✌ Important parameters
estimator:
Need to pass in the model object, for example: RandomForestRegression(), SVC(gamma=0.001)
x:
Feature matrix
Y:
Need to pass in label
cv:
Multiple format parameters can be passed:
(1), Integer: Specify the fold number in KFold, such as cv=5, which means that the x feature matrix is divided into 5 parts, and the final score will also have 5 parts
(2), None: default For 3-fold cross-validation
(3), splitter: For example, ShuffleSplit(n_splits=50,test_size=0.2,random_state=0)
is split according to the incoming splitter
n_jobs:
The number of CPUs that need to run at the same time, if it is -1, all CPUs are called for calculation
4. ✌ Function return value
train_sizes_abs:
Returns the number of training samples generated, such as [10, 100, 1000]
train_scores:
Returns the score of the training set. The matrix is the score of the dimension (len (train_sizes_abs), the number of cv divisions), and
each row of data represents the score of the number of samples corresponding to different folds
test_scores:
Same as train_scores, but this corresponds to the test set score
5. ✌ Code example
The learning curve is by drawing the accuracy of the training set and cross-validation for different training set sizes, you can see the performance of the model on the new data, and then determine whether the variance of the model is too high or the deviation is too high, and whether to increase the training set Can reduce overfitting.
✌ Guide library
from sklearn.datasets import load_digits # 导入手写数字集
from sklearn.model_selection import learning_curve # 导入学习曲线类
✌ Load data
fig,ax=plt.subplots(1,1,figsize=(6,6)) # 设置画布和子图
data=load_digits()
x,y=data.data,data.target # 加载特征矩阵和标签
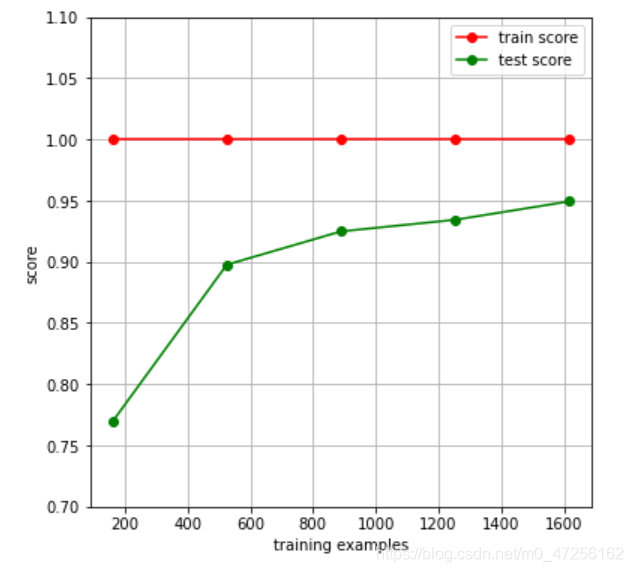
✌ Drawing
train_sizes,train_scores,test_scores=learning_curve(RandomForestClassifier(n_estimators=50),x,y,cv=10,n_jobs=4)
# 设置分类器为随机森林,x,y,5折交叉验证,cpu同时运算为4个
ax.set_ylim((0.7,1.1)) # 设置子图的纵坐标的范围为(0.7~1.1)
ax.set_xlabel("training examples") # 设置子图的x轴名称
ax.set_ylabel("score")
ax.grid() # 画出网图
ax.plot(train_sizes,np.mean(train_scores,axis=1),'o-',color='r',label='train score')
# 画训练集数据分数,横坐标为用作训练的样本数,纵坐标为不同折下的训练分数的均值
ax.plot(train_sizes,np.mean(test_scores,axis=1),'o-',color='g',label='test score')
ax.legend(loc='best') # 设置图例

plt.show()