上文我们讲解了添加工具操作,这一节我们讲解给生成图形添加默认布局
1.准备工作
多添加几个几点:生成如下所示的图形
代码:
 try {


        var v1 = graph.insertVertex(
          parent,
          null,
          "Hello,",
          20,
          200,
          100,
          50,
          'nodeStyle'
        );
        var v2 = graph.insertVertex(
          parent,
          null,
          "World",
          150,
          200,
          100,
          50,
          'nodeStyle'
        );

        var v3 = graph.insertVertex(
          parent,
          null,
          "I",
          300,
          200,
          100,
          50,
          'nodeStyle'
        );

        var v4 = graph.insertVertex(
          parent,
          null,
          "Love",
          450,
          200,
          100,
          50,
          'nodeStyle'
        );

        var v5 = graph.insertVertex(
          parent,
          null,
          "You",
          600,
          200,
          100,
          50,
          'nodeStyle'
        );

        var v6 = graph.insertVertex(
          parent,
          null,
          "My girl",
          750,
          200,
          100,
          50,
          'nodeStyle'
        );
        graph.insertEdge(parent, null, "", v1, v2);
        graph.insertEdge(parent, null, "", v1, v3);
        graph.insertEdge(parent, null, "", v2, v4);
        graph.insertEdge(parent, null, "", v4, v5);
        graph.insertEdge(parent, null, "", v5, v6);
      } finally {


        // Updates the display
        graph.getModel().endUpdate();
      }
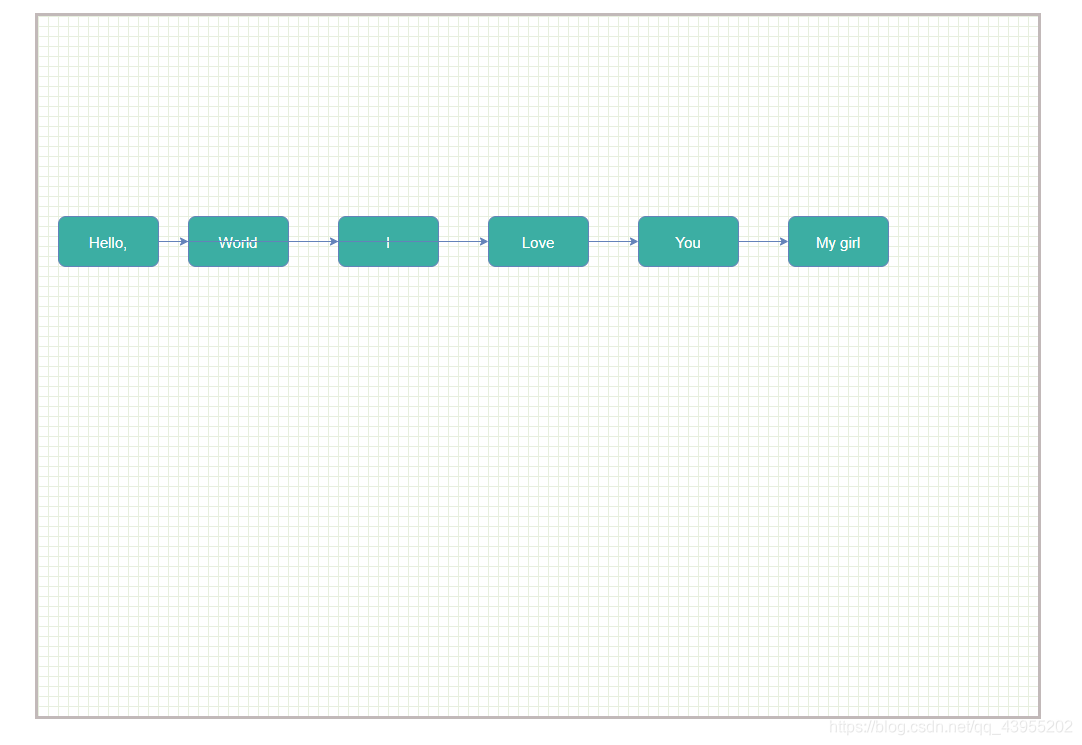
我们拉扯后发现是这样的;
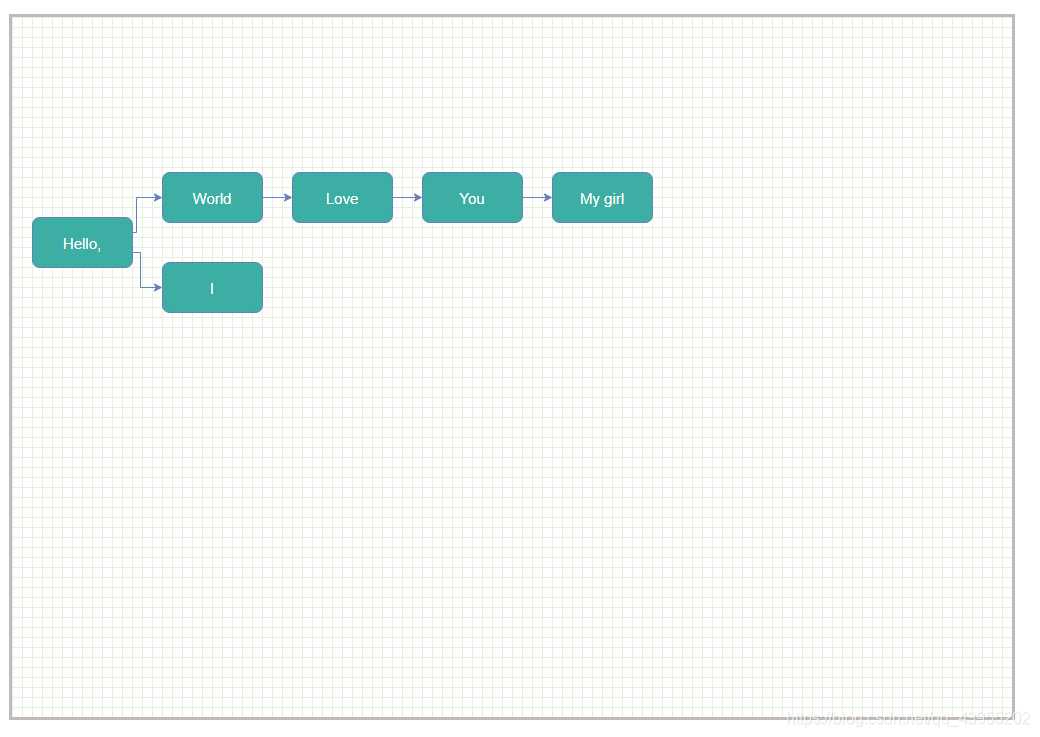
2.接下来使用布局算法
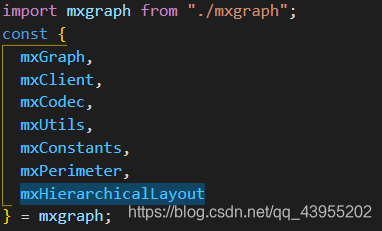
第一步:引入mxHierarchicalLayout
直接添加即可
- 引入布局方式
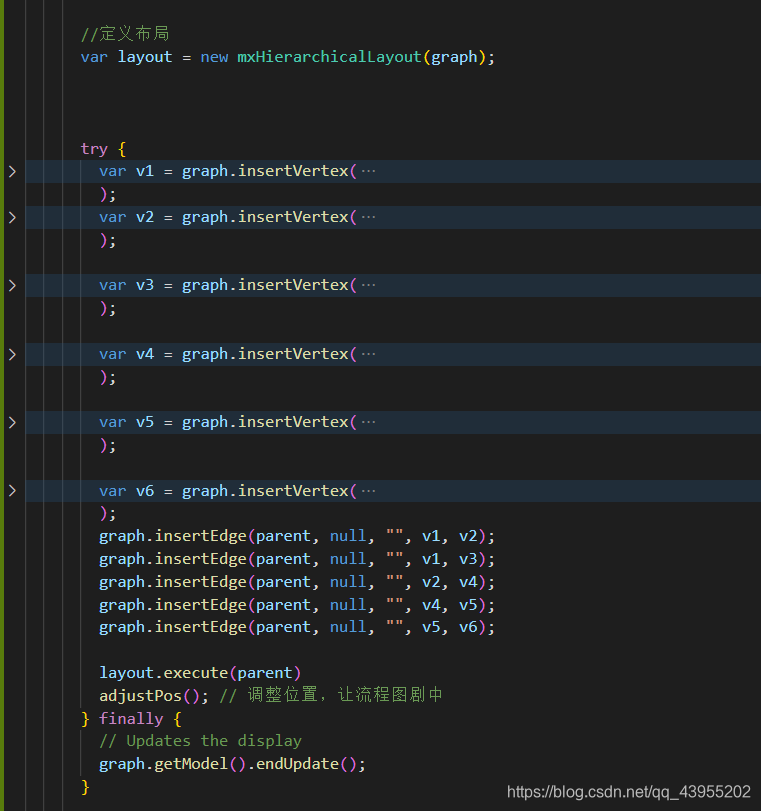
 //定义布局
      var layout = new mxHierarchicalLayout(graph);
- 在布局更新前使用布局
layout.execute(parent)
所有代码:
<template>
  <div>


    <div id="graphContainer"></div>


  </div>
</template>

<script>
import mxgraph from "./mxgraph";
const {


  mxGraph,
  mxClient,
  mxCodec,
  mxUtils,
  mxConstants,
  mxPerimeter,
  mxHierarchicalLayout
} = mxgraph;

export default {


  mounted() {


    if (!mxClient.isBrowserSupported()) {


      // 判断是否支持mxgraph
      mxUtils.error("Browser is not supported!", 200, false);
    } else {


      // 在容器中创建图表
      let container = document.getElementById("graphContainer");

      var graph = new mxGraph(container);

      // 生成 Hello world!
      var parent = graph.getDefaultParent();
      graph.getModel().beginUpdate();

      //定义节点样式
      var nodeStyle = {

    };
      nodeStyle[mxConstants.STYLE_FILLCOLOR] = "#3CAEA3";
      nodeStyle[mxConstants.STYLE_FONTSIZE] = 15;
      nodeStyle[mxConstants.STYLE_STROKE_COLOR] = "white";
      nodeStyle[mxConstants.STYLE_FONTCOLOR] = "white";
      nodeStyle[mxConstants.STYLE_ROUNDED] = 1;

      // 把定义好的样式object push到stylesheet
      graph.getStylesheet().putCellStyle("nodeStyle", nodeStyle)


      //定义布局
      var layout = new mxHierarchicalLayout(graph);


      try {


        var v1 = graph.insertVertex(
          parent,
          null,
          "Hello,",
          20,
          200,
          100,
          50,
          'nodeStyle'
        );
        var v2 = graph.insertVertex(
          parent,
          null,
          "World",
          150,
          200,
          100,
          50,
          'nodeStyle'
        );

        var v3 = graph.insertVertex(
          parent,
          null,
          "I",
          300,
          200,
          100,
          50,
          'nodeStyle'
        );

        var v4 = graph.insertVertex(
          parent,
          null,
          "Love",
          450,
          200,
          100,
          50,
          'nodeStyle'
        );

        var v5 = graph.insertVertex(
          parent,
          null,
          "You",
          600,
          200,
          100,
          50,
          'nodeStyle'
        );

        var v6 = graph.insertVertex(
          parent,
          null,
          "My girl",
          750,
          200,
          100,
          50,
          'nodeStyle'
        );
        graph.insertEdge(parent, null, "", v1, v2);
        graph.insertEdge(parent, null, "", v1, v3);
        graph.insertEdge(parent, null, "", v2, v4);
        graph.insertEdge(parent, null, "", v4, v5);
        graph.insertEdge(parent, null, "", v5, v6);

        layout.execute(parent)
      } finally {


        // Updates the display
        graph.getModel().endUpdate();
      }


  },

};
</script>

<style>
#graphContainer {


  width: 1000px;
  height: 700px;
  border: 3px solid rgb(194, 185, 185);
  background-image: url("../assets/grid.gif");
  margin: auto;
}


</style>
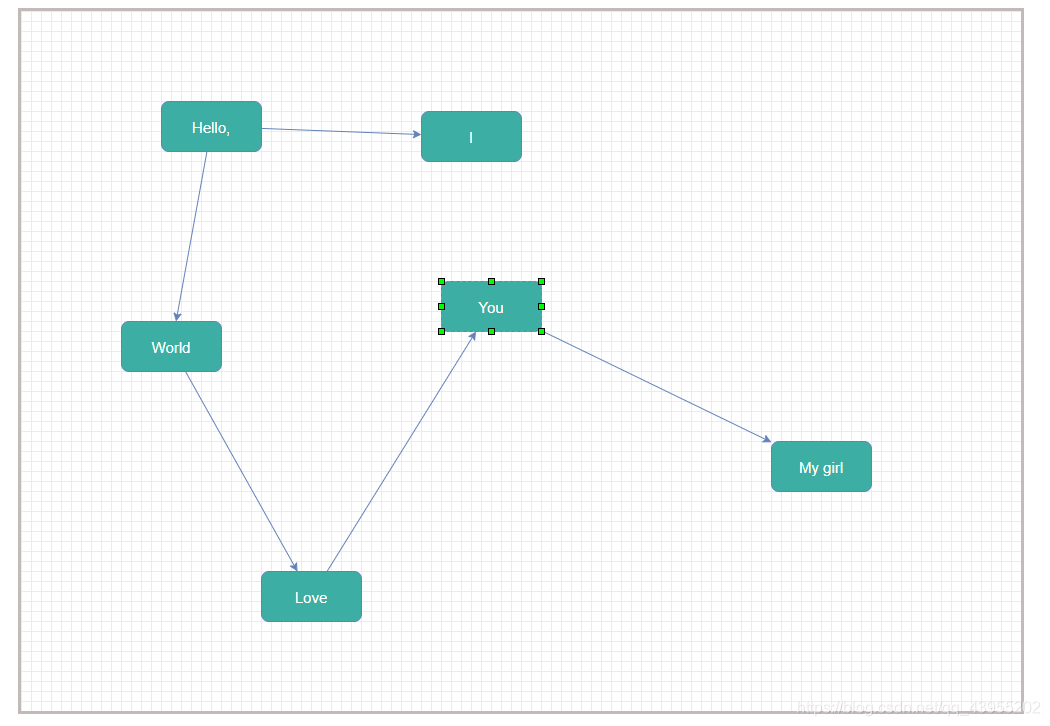
生成图形: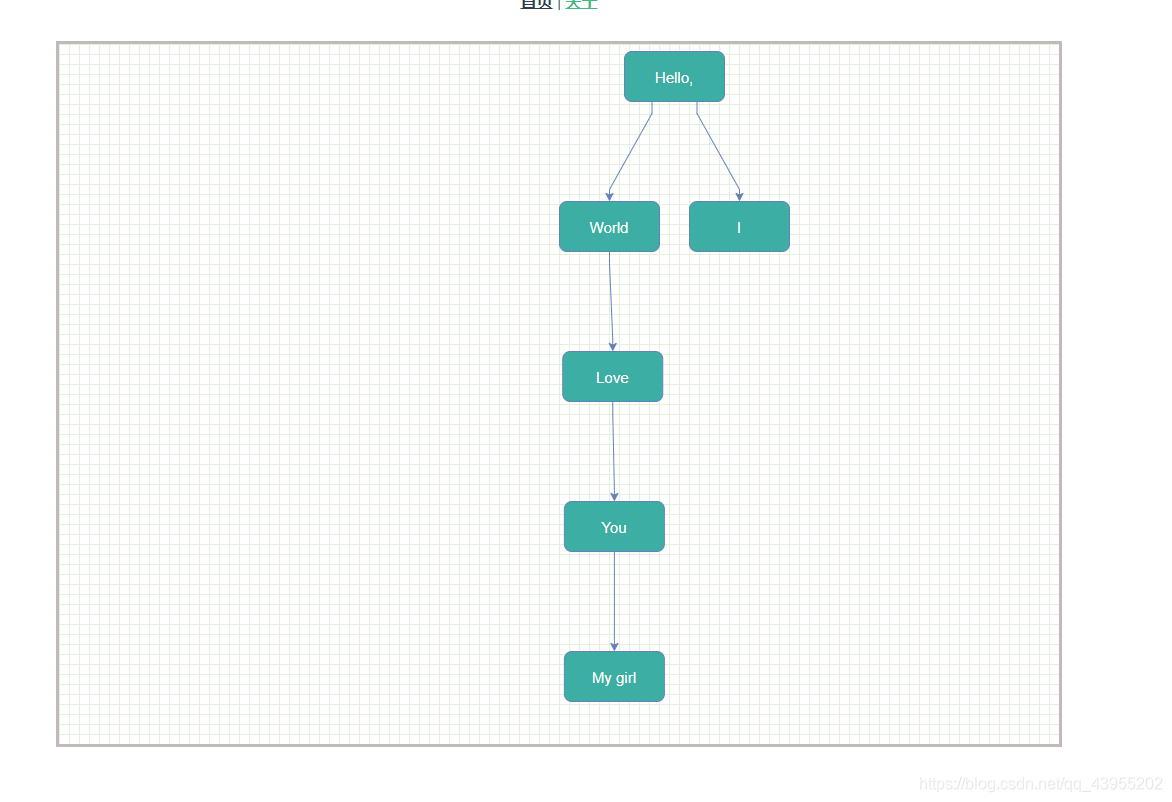
使用其他布局算法:mxCompactTreeLayout
布局算法 API文档查看地址:
布局算法 API文档