项目介绍:利用SVM支持向量机来区分综合国力的强弱
0.整理数据
0.下载数据
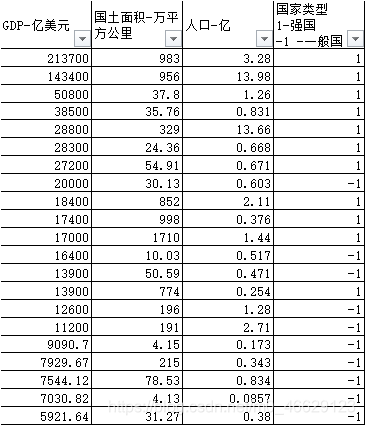
从https://www.kylc.com/stats/global/yearly_overview/g_gdp.html下载GDP、国土面积、人口等数据,并做好国家类型标签,并整理成Excel档案。
1.引入svmMLiA.py并读取数据
import svmMLiA

import pandas as pd
import numpy as np
%matplotlib inline
%matplotlib notebook
import matplotlib.pyplot as plt
from numpy import *
import pandas as pd

# 导入数据
# 导入数据
filename='Nation20200923_np2-3 factors.xlsx'
feature_num=3
dataArr,labelArr = svmMLiA.file2matrix(filename,feature_num)
2. 准备数据:归一化数据
dataArr, ranges, minVals = svmMLiA.autoNorm(dataArr)
dataArr
#array([[1.00000000e+00, 5.74853751e-01, 2.34614536e-01],
#       [6.71034160e-01, 5.59064276e-01, 1.00000000e+00],
#       [2.37716424e-01, 2.21051488e-02, 9.01212056e-02],

labelArr[:5]
#array([1., 1., 1., 1., 1.])
3. 运用简化SMO算法,并返回b,alphas
# 运用简化SMO算法,并返回b,alphas
b,alphas = svmMLiA.smoSimple(dataArr, labelArr, 0.6, 0.001, 40)
b
#matrix([[-1.17644252]])
4.打印支持向量
# 打印支持向量
for i in range(100):
    if alphas[i] > 0.0:
    	print(dataArr[i],labelArr[i],i)
        i_list.append(i)

[1.         0.57485375 0.23461454] 1.0 0
[0.67103416 0.55906428 1.        ] 1.0 1
[0.23771642 0.02210515 0.09012121] 1.0 2
[0.1801591  0.02091217 0.05943426] 1.0 3
[0.13476837 0.19239757 0.97710997] 1.0 4
[0.13242864 0.0142455  0.04777465] 1.0 5
[0.12728123 0.032111   0.04798924] 1.0 6
[0.08610201 0.49824556 0.15092285] 1.0 8
[0.08142255 0.58362568 0.02688749] 1.0 9
[0.07955077 1.         0.10299685] 1.0 10
[0.06504445 0.45263151 0.01816067] 1.0 13
[0.05896116 0.11461978 0.09155183] -1.0 14
[0.05240992 0.1116958  0.19384167] -1.0 15
[0.03710655 0.12573089 0.02452696] -1.0 17
[0.02104179 0.162573   0.03210928] -1.0 24
[0.02096958 0.05402328 0.14376972] -1.0 25
[0.02083973 0.10233908 0.05929119] -1.0 27
[0.01301928 0.04655544 0.15521474] -1.0 42
[0.0084306  0.15906423 0.013225  ] -1.0 53
[0.00795452 0.13918119 0.03082171] -1.0 54
[0.00221432 0.136842   0.06208092] -1.0 89
5.分类预测:If this value is greater than 0, then its class is a 1, and the class is -1 if it’s less than 0.
# 打印w
ws=svmMLiA.calcWs(alphas,dataArr,labelArr)
ws
#array([[1.1672808 ],
#       [1.36732352],
#       [0.6287355 ]])

#循环预测
datMat = mat(dataArr)
num = 214
error_count=0
for i in range(num):
    predict_value = datMat[i]*mat(ws)+b
    if predict_value > 0:
        predict_value = 1
    else:
        predict_value = -1
    actual_value = labelArr[i]
    if predict_value == actual_value:
        result = 'right'
    else:
        result = 'wrong'
        error_count = error_count+1
    print(predict_value,actual_value,result)
print('error rate : {:.2%}'.format(error_count/num))
#-1 -1.0 right
#-1 -1.0 right
#-1 -1.0 right
#-1 -1.0 right
#-1 -1.0 right
#-1 -1.0 right
#-1 -1.0 right
#-1 -1.0 right
#error rate : 3.74%
引入svmMLiA.py
from numpy import *
from time import sleep
import pandas as pd
import numpy as np


def file2matrix(filename,feature_num):
    df = pd.read_excel(filename)
    #df = df.reindex(np.random.permutation(df.index))
    #df.to_excel('random.xlsx')
    df_values = df.values
    returnMat = df_values[:,:feature_num]
    classLabelVector = df_values[:,-1]
    return returnMat,classLabelVector

def autoNorm(dataSet):
    minVals = dataSet.min(0)
    maxVals = dataSet.max(0)
    ranges = maxVals - minVals
    normDataSet = zeros(shape(dataSet))
    m = dataSet.shape[0]
    normDataSet = dataSet - tile(minVals, (m,1))
    normDataSet = normDataSet/tile(ranges, (m,1))   #element wise divide
    return normDataSet, ranges, minVals

def loadDataSet(fileName):
    dataMat = []; labelMat = []
    fr = open(fileName)
    for line in fr.readlines():
        lineArr = line.strip().split('\t')
        dataMat.append([float(lineArr[0]), float(lineArr[1])])
        labelMat.append(float(lineArr[2]))
    return dataMat,labelMat

def selectJrand(i,m):
    j=i #we want to select any J not equal to i
    while (j==i):
        j = int(random.uniform(0,m))
    return j

def clipAlpha(aj,H,L):
    if aj > H:
        aj = H
    if L > aj:
        aj = L
    return aj

def smoSimple(dataMatIn, classLabels, C, toler, maxIter):
    dataMatrix = mat(dataMatIn); labelMat = mat(classLabels).transpose()
    b = 0; m,n = shape(dataMatrix)
    alphas = mat(zeros((m,1)))
    iter = 0
    while (iter < maxIter):
        alphaPairsChanged = 0
        for i in range(m):
            fXi = float(multiply(alphas,labelMat).T*(dataMatrix*dataMatrix[i,:].T)) + b
            Ei = fXi - float(labelMat[i])#if checks if an example violates KKT conditions
            if ((labelMat[i]*Ei < -toler) and (alphas[i] < C)) or ((labelMat[i]*Ei > toler) and (alphas[i] > 0)):
                j = selectJrand(i,m)
                fXj = float(multiply(alphas,labelMat).T*(dataMatrix*dataMatrix[j,:].T)) + b
                Ej = fXj - float(labelMat[j])
                alphaIold = alphas[i].copy(); alphaJold = alphas[j].copy();
                if (labelMat[i] != labelMat[j]):
                    L = max(0, alphas[j] - alphas[i])
                    H = min(C, C + alphas[j] - alphas[i])
                else:
                    L = max(0, alphas[j] + alphas[i] - C)
                    H = min(C, alphas[j] + alphas[i])
                if L==H: print( "L==H"); continue
                eta = 2.0 * dataMatrix[i,:]*dataMatrix[j,:].T - dataMatrix[i,:]*dataMatrix[i,:].T - dataMatrix[j,:]*dataMatrix[j,:].T
                if eta >= 0: print ("eta>=0"); continue
                alphas[j] -= labelMat[j]*(Ei - Ej)/eta
                alphas[j] = clipAlpha(alphas[j],H,L)
                if (abs(alphas[j] - alphaJold) < 0.00001): print ("j not moving enough"); continue
                alphas[i] += labelMat[j]*labelMat[i]*(alphaJold - alphas[j])#update i by the same amount as j
                                                                        #the update is in the oppostie direction
                b1 = b - Ei- labelMat[i]*(alphas[i]-alphaIold)*dataMatrix[i,:]*dataMatrix[i,:].T - labelMat[j]*(alphas[j]-alphaJold)*dataMatrix[i,:]*dataMatrix[j,:].T
                b2 = b - Ej- labelMat[i]*(alphas[i]-alphaIold)*dataMatrix[i,:]*dataMatrix[j,:].T - labelMat[j]*(alphas[j]-alphaJold)*dataMatrix[j,:]*dataMatrix[j,:].T
                if (0 < alphas[i]) and (C > alphas[i]): b = b1
                elif (0 < alphas[j]) and (C > alphas[j]): b = b2
                else: b = (b1 + b2)/2.0
                alphaPairsChanged += 1
                print ("iter: %d i:%d, pairs changed %d" % (iter,i,alphaPairsChanged))
        if (alphaPairsChanged == 0): iter += 1
        else: iter = 0
        print ("iteration number: %d" % iter)
    return b,alphas


def calcWs(alphas,dataArr,classLabels):
    X = mat(dataArr); labelMat = mat(classLabels).transpose()
    m,n = shape(X)
    w = zeros((n,1))
    for i in range(m):
        w += multiply(alphas[i]*labelMat[i],X[i,:].T)
    return w