AlertManager告警分配路由配置
1.route路由配置文件介绍
route:
  group_by: ['alertname']								//定义分组
  group_wait: 10s								//分组等待时间
  group_interval: 10s						//收到告警后多长时间发送给接收者
  repeat_interval: 10m							//重复告警间隔
  receiver: 'yunwei'							//默认邮箱
  routes:									//启用一个子路由
  - receiver: 'dba'								//接收者为dba
    group_wait: 10s									//分组等待时间
    match_re:								//匹配一个正则
      service: mysql|db						//service标签包含mysql和db的统一发送给dba的邮箱
  - receiver: 'yunwei'					//接收者为yunwei
    group_wait: 10s							//分组时间
    match_re:
      service: error								//将service标签值包含error的发送给yunwei的邮箱

receivers:							//定义接收者的邮箱
- name: 'yunwei'							//接收者名字,要和routes中的receiver对应
  email_configs:
  - to: '[email protected]'						//yunwei的邮箱地址
- name: 'dba'								//接收者名字,要和routes中的receiver对应
  email_configs:
  - to: '[email protected]'						//dba的邮箱地址
2.需求描述
需求:server标签包含db、mysql的发送给dba的邮箱,其他的都发送给运维的邮箱
最终效果:要求关于mysql等数据库的告警发送给dba、其他的信息发送给运维
3.alertmanager实现不同的告警内容发送给不同的接收人
3.1.修改配置文件
1.修改配置文件
[root@prometheus-server /data/AlertManager]# vim AlertManager.yml
global:
resolve_timeout: 5m
smtp_smarthost: 'smtp.qq.com:465'
smtp_from: '[email protected]'
smtp_auth_username: '[email protected]'
smtp_auth_password: 'yzjqxhsranbpdijd'
smtp_require_tls: false
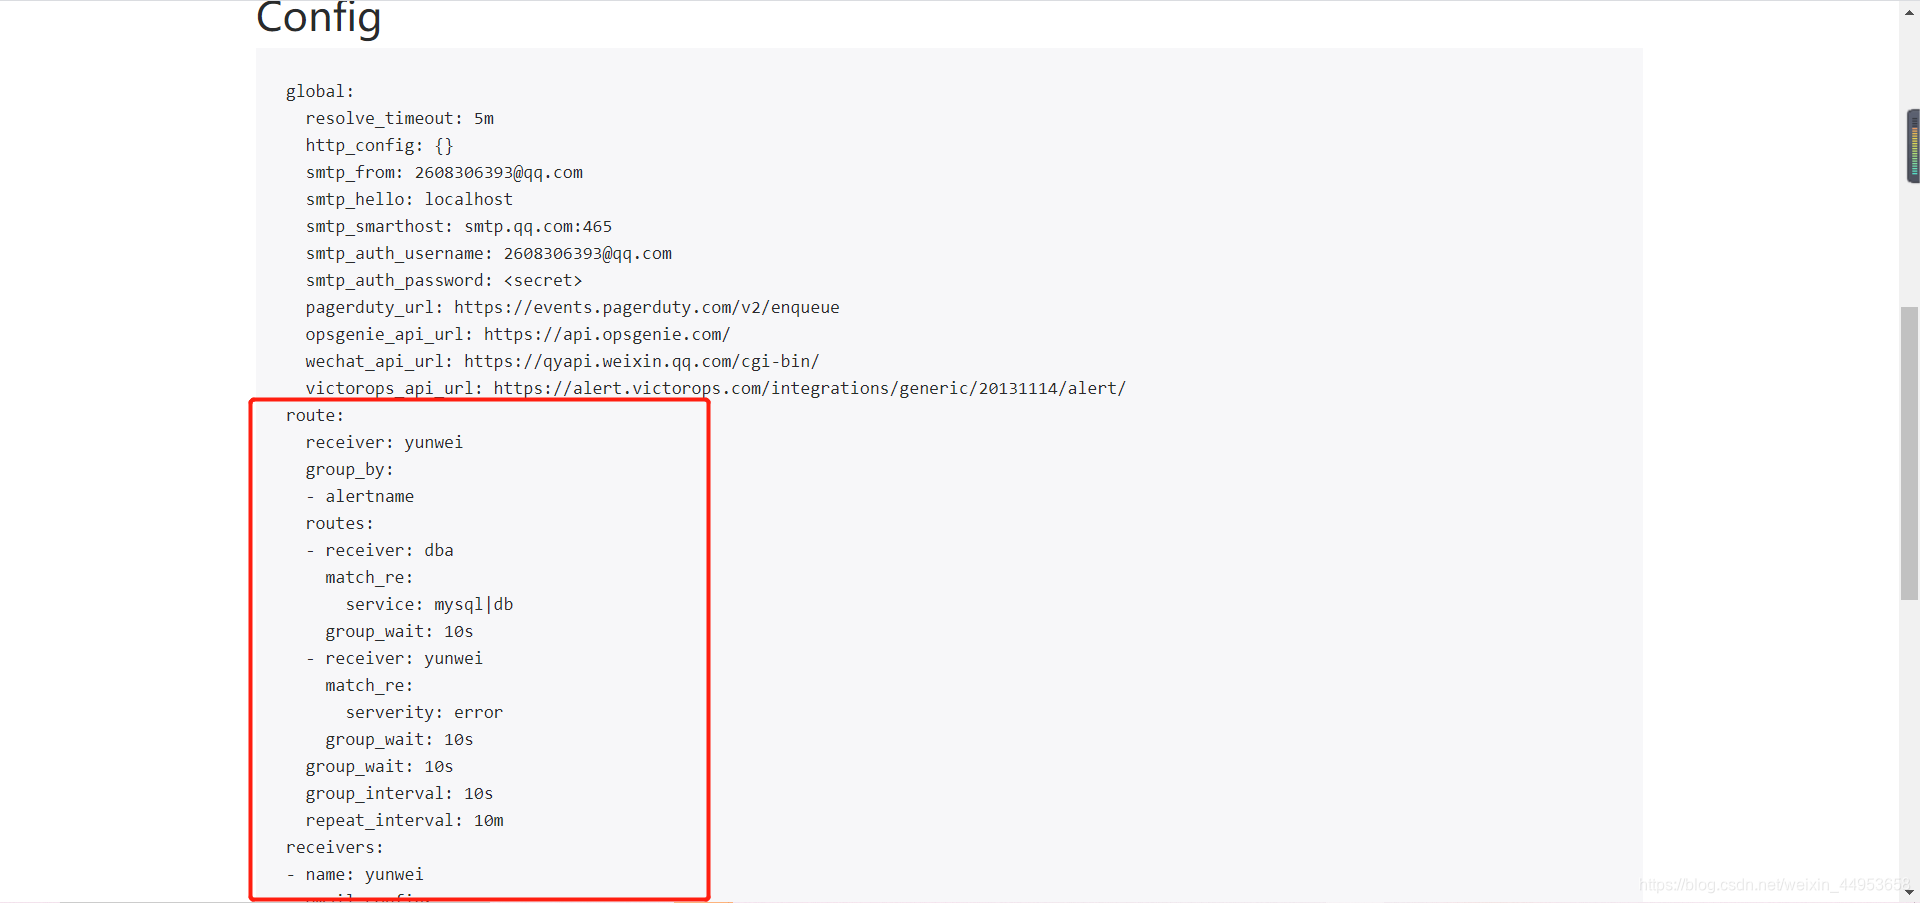
route:
group_by: ['alertname']
group_wait: 10s
group_interval: 10s
repeat_interval: 10m
receiver: 'yunwei'
routes:
- receiver: 'dba'
group_wait: 10s
match_re:
service: mysql|db
- receiver: 'yunwei'
group_wait: 10s
match_re:
serverity: error
receivers:
- name: 'yunwei'
email_configs:
- to: '[email protected]'
- name: 'dba'
email_configs:
- to: '[email protected]'
2.重启生效
[root@prometheus-server /data/AlertManager]# ps aux | grep alert | grep -v grep | awk '{print $2}' |xargs kill -HUP

配置已生效
3.2.定义mysql告警规则
3.2.1.开启node_exporter监控mysql
直接在启动时加上mysql服务监控即可
[root@192_168_81_220 ~]# vim /usr/lib/systemd/system/node_exporter.service
ExecStart=/data/node_exporter/node_exporter --collector.systemd --collector.systemd.unit-whitelist=(docker|sshd|node_exporter|mariadb).service

[root@192_168_81_220 ~]# systemctl daemon-reload
[root@192_168_81_220 ~]# systemctl restart node_exporter.service
查看页面是否已经有mysql监控
node_systemd_unit_state{name="mariadb.service",state="active"}

3.2.2.编写告警规则
1.编写规则
[root@prometheus-server /data/prometheus]# vim rules/hostdown.yml
groups:
- name: general.rules
rules:
- alert: 主机宕机
expr: up == 0
for: 1m
labels:
serverity: error
annotations:
summary: "主机 {
{ $labels.instance }} 停止工作"
description: "{
{ $labels.instance }} job {
{ $labels.job }} 已经宕机5分钟以上!"
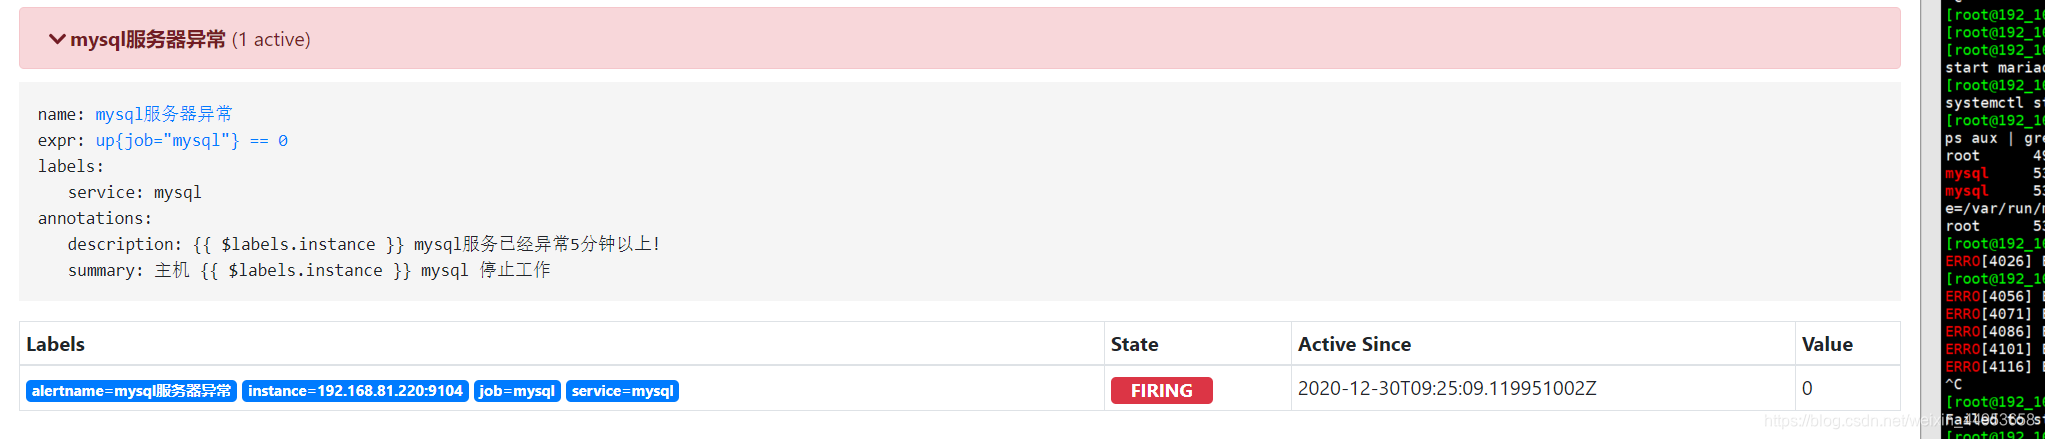
- alert: mysql服务器异常
expr: up{job="mysql"} == 0
labels:
service: mysql
annotations:
summary: "主机 {
{ $labels.instance }} mysql 停止工作"
description: "{
{ $labels.instance }} mysql服务已经异常5分钟以上!"
2.加载配置
[root@prometheus-server /data/prometheus]# curl -XPOST 192.168.81.210:9090/-/reload
3.3.触发mysql报警
3.3.1.停掉192.168.81.220上的mysql_exporter
[root@192_168_81_220 ~]# ps aux | grep mysql_exporter | awk '{print $2}' |xargs kill -9
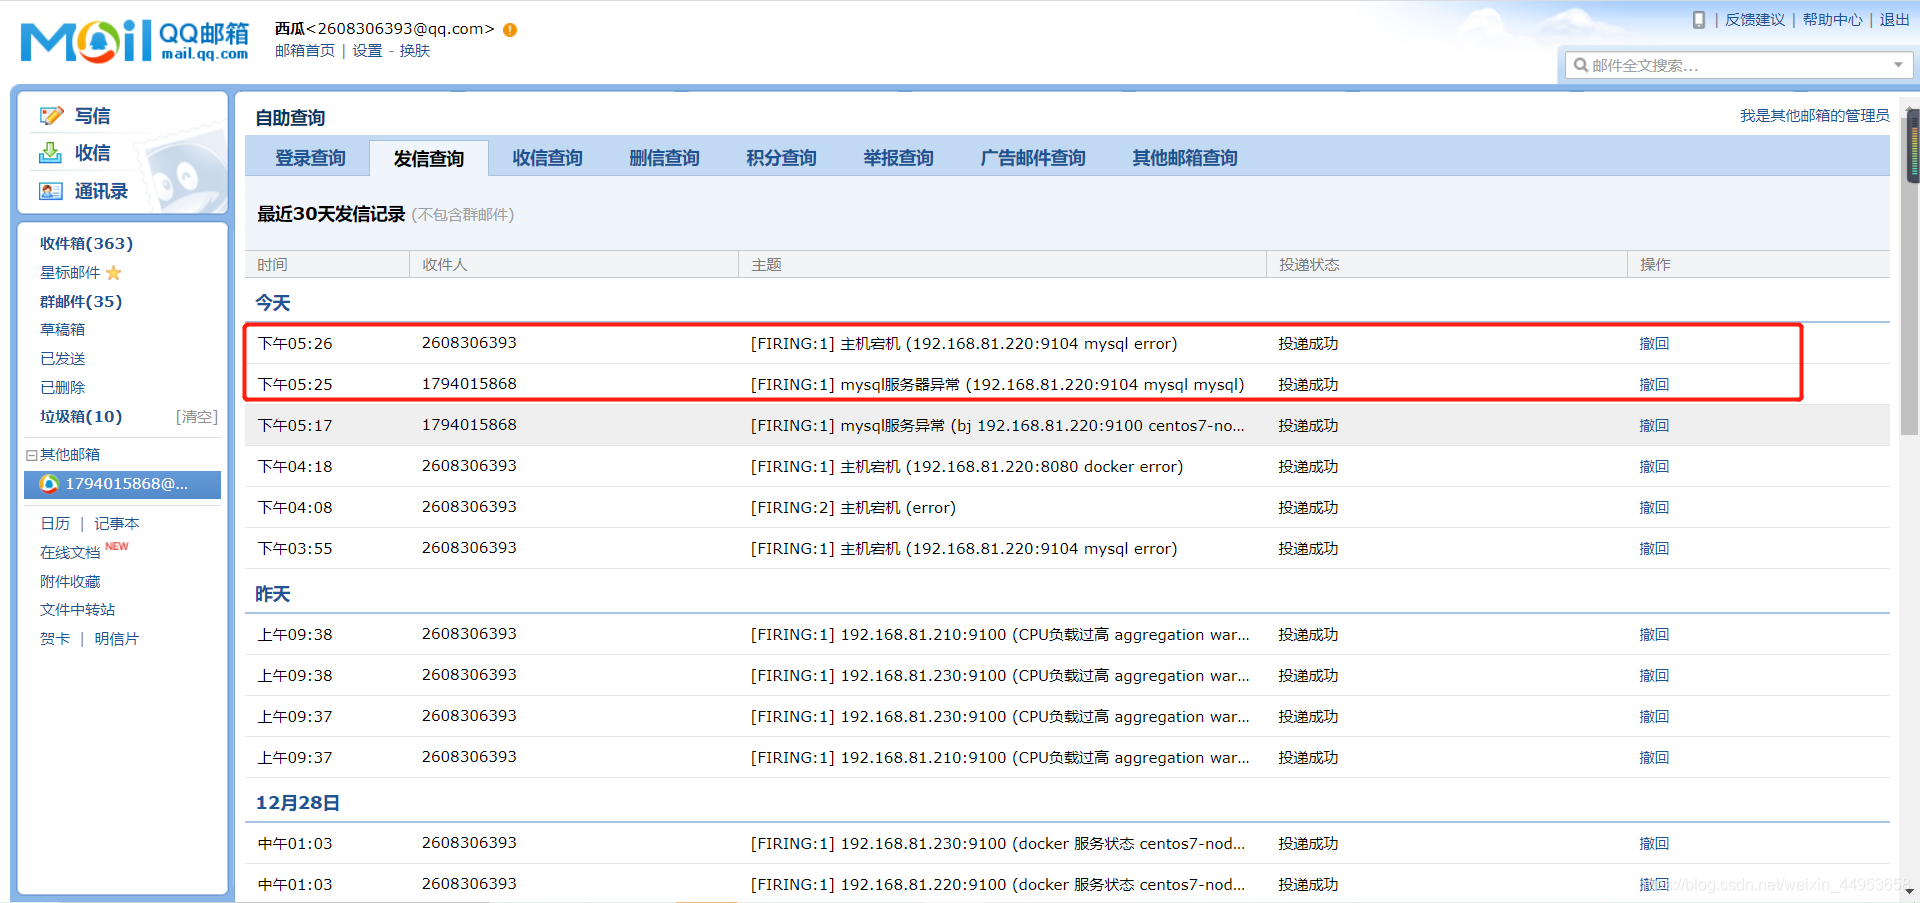
3.3.2.alert已经发送报警
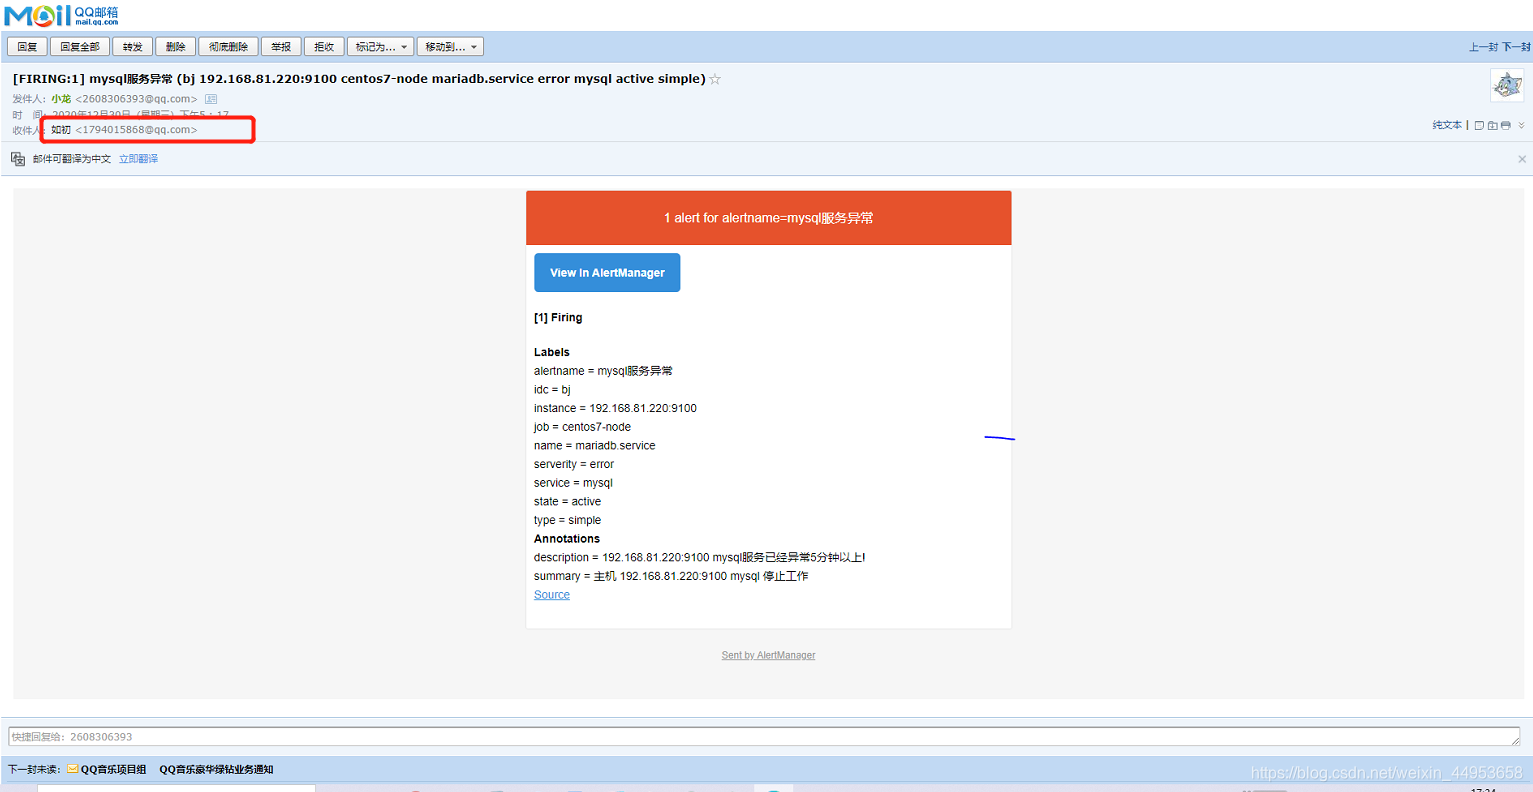
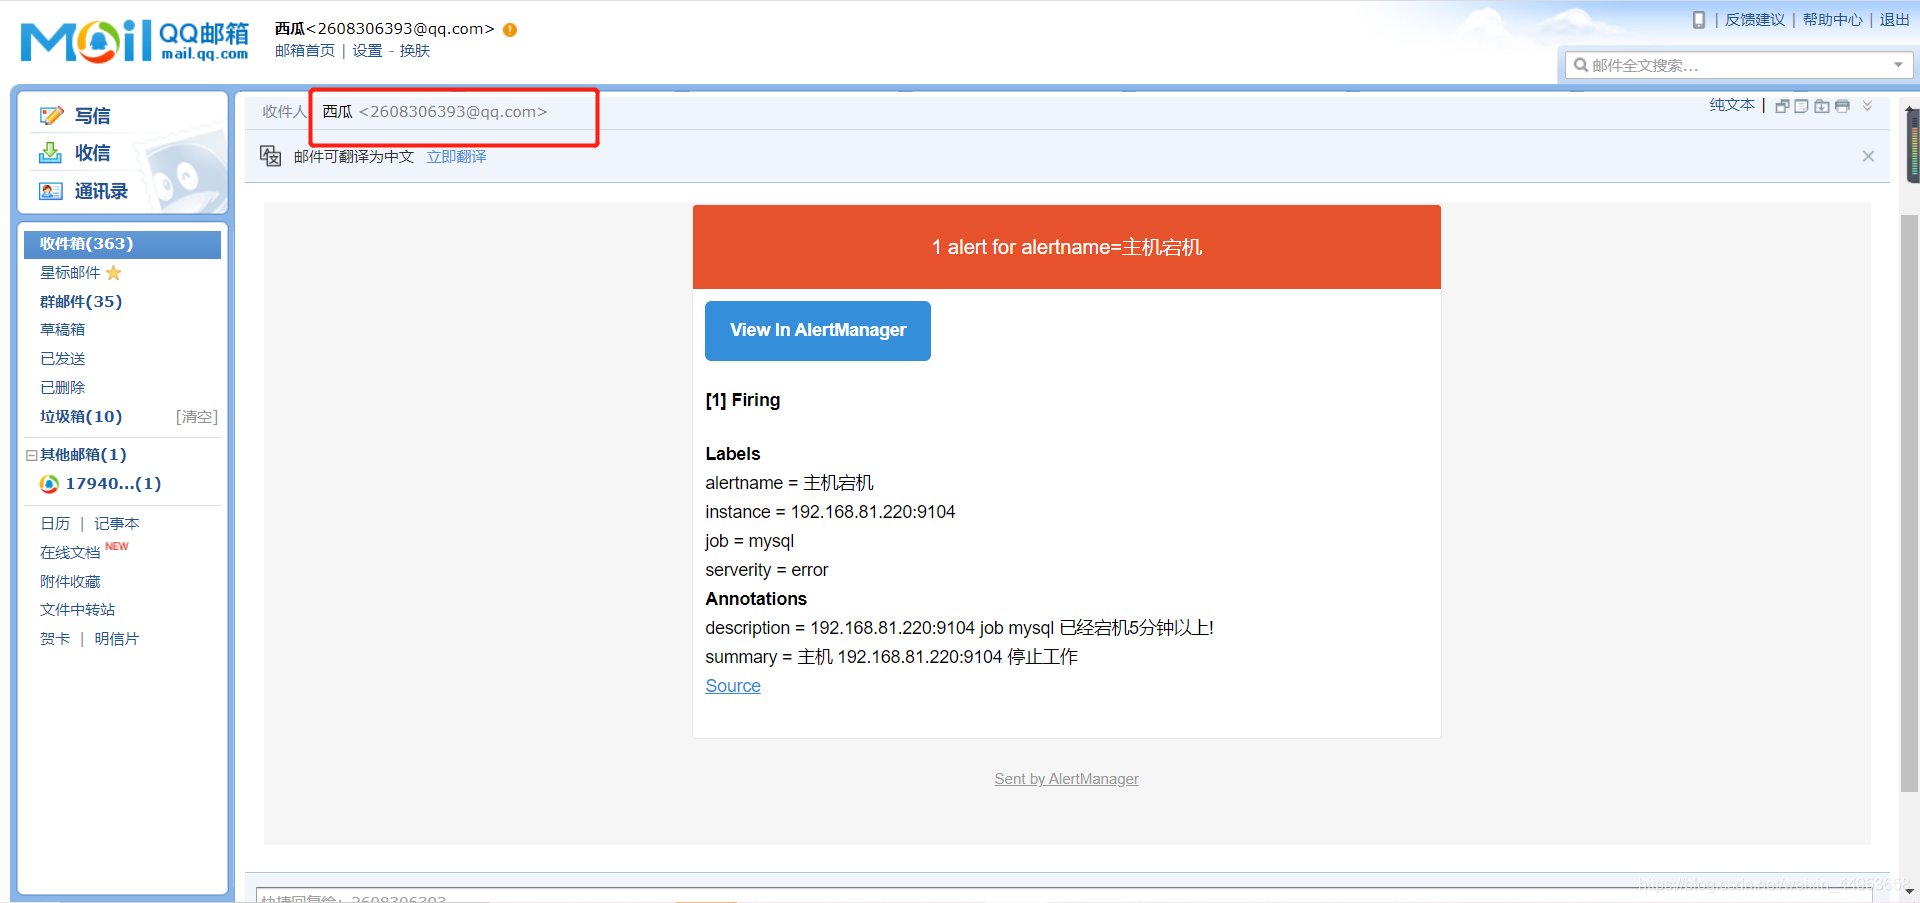
3.3.3.error已经发送给运维邮箱
扫描二维码关注公众号,回复:
13086424 查看本文章

3.3.4.mysql已经发送给dba邮箱