1.创建RandomWalk()类
from random import choice

class RandomWalk():
    """A class to generate random walks."""

    def __init__(self, num_points=5000):
        """Initialize attributes of a walk."""
        self.num_points = num_points

        # All walks start at (0, 0).
        self.x_values = [0]
        self.y_values = [0]

    def fill_walk(self):
        """Calculate all the points in the walk."""

        # Keep taking steps until the walk reaches the desired length.
        while len(self.x_values) < self.num_points:

            # Decide which direction to go, and how far to go in that direction.
            x_direction = choice([1, -1])
            x_distance = choice([0, 1, 2, 3, 4])
            x_step = x_direction * x_distance

            y_direction = choice([1, -1])
            y_distance = choice([0, 1, 2, 3, 4])
            y_step = y_direction * y_distance

            # Reject moves that go nowhere.
            if x_step == 0 and y_step == 0:
                continue

            # Calculate the next x and y values.
            next_x = self.x_values[-1] + x_step
            next_y = self.y_values[-1] + y_step

            self.x_values.append(next_x)
            self.y_values.append(next_y)
2.绘制随机漫步图
import matplotlib.pyplot as plt

from random_walk import RandomWalk

rw=RandomWalk()
rw.fill_walk()
plt.scatter(rw.x_values,rw.y_values,s=15)
plt.show()

3.设置随机漫步图的样式
使用颜色映射来指出漫步中各点的先后顺序,并删除每个点的黑色轮廓。
point_numbers=list(range(rw.num_points))
plt.scatter(rw.x_values,rw.y_values,c=point_numbers,cmap=plt.cm.Blues,edgecolor='none',s=15)

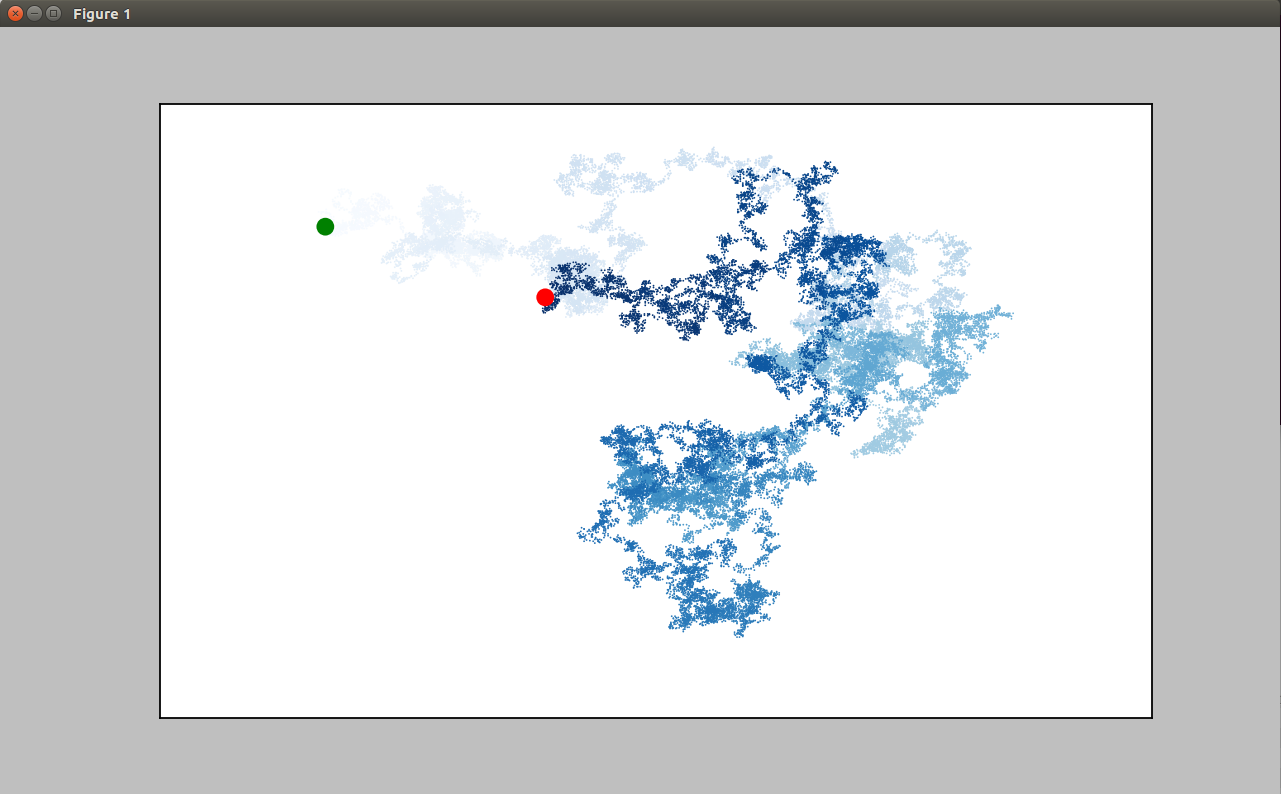
4.重新绘制起点和终点&隐藏坐标轴
plt.scatter(0,0,c='green',edgecolor='none',s=100)
plt.scatter(rw.x_values[-1],rw.y_values[-1],c='red',edgecolor='none',s=100)

plt.axes().get_xaxis().set_visible(False)
plt.axes().get_yaxis().set_visible(False)

5.增加点数&绘制窗口尺寸
首先修改随机漫步类的定义:
def __init__(self, num_points=50000):
以下给出rw_visual.py的完整代码:
import matplotlib.pyplot as plt

from random_walk import RandomWalk

rw=RandomWalk()
rw.fill_walk()

plt.figure(dpi=128,figsize=(10,6))

point_numbers=list(range(rw.num_points))
plt.scatter(rw.x_values,rw.y_values,c=point_numbers,cmap=plt.cm.Blues,edgecolor='none',s=1)

plt.scatter(0,0,c='green',edgecolor='none',s=100)
plt.scatter(rw.x_values[-1],rw.y_values[-1],c='red',edgecolor='none',s=100)

plt.axes().get_xaxis().set_visible(False)
plt.axes().get_yaxis().set_visible(False)

plt.show()