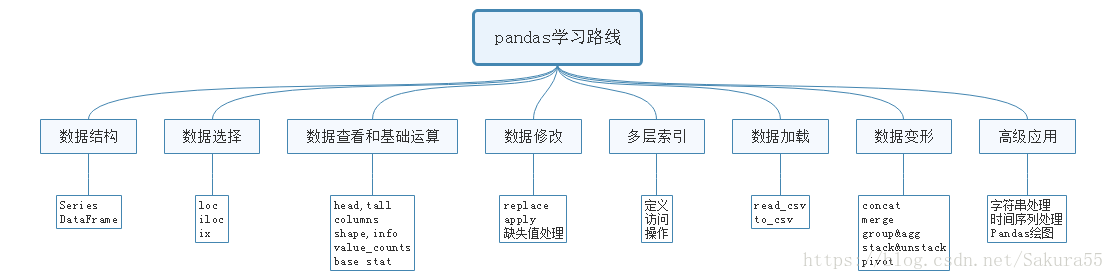
1、学习路线
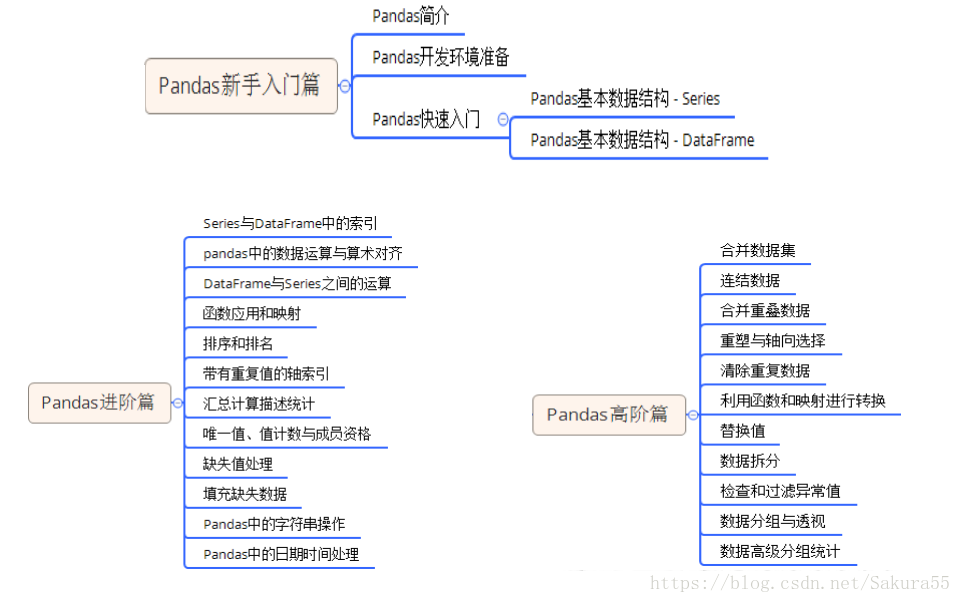
2、学习阶段
3创建Series以及DataFrame
3.1 Series
from pandas import Series,DataFrame
import pandas as pd
import numpy as np
#通过列表创建
obj = Series([1,2,3,4,'a'])
obj
#通过加索引创建
series1 = Series(['小张','2'],index = ["a",'b'])
series1
randomNum = Series(np.arange(5),index=['a','b','c','d','e'])
randomNum
#通过字典创建Series
names ={'Jack':33,"小红":88}
age = Series(names)
age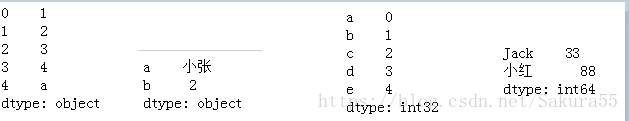
3.2 DataFrame
from pandas import Series,DataFrame
import pandas as pd
import numpy as np
#####################方法1  用字典
pop = {'省份':['江苏','浙江','上海'],
      '年份':[2012,2052,3945],
      '人口':['20万','30万','90万']}

df = DataFrame(pop)
#自定义DataFrame的列索引
df = DataFrame(pop,columns=['省份','年份','人口'])
df
#获取DataFrame的数据
df[["省份",'人口']]
#获取行
df[0:1]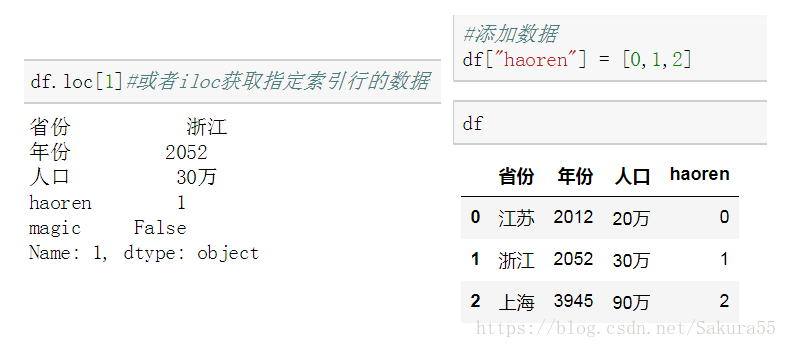
#######################方法2  Series
series = Series([1,2,34])
series
#替换
df["haoren"] = series
df
list(df.index)#########获取的是索引的列表df["magic"] = df.省份 == '上海'
#删除一列
del df["magic"]
df
#获取列名
df.columns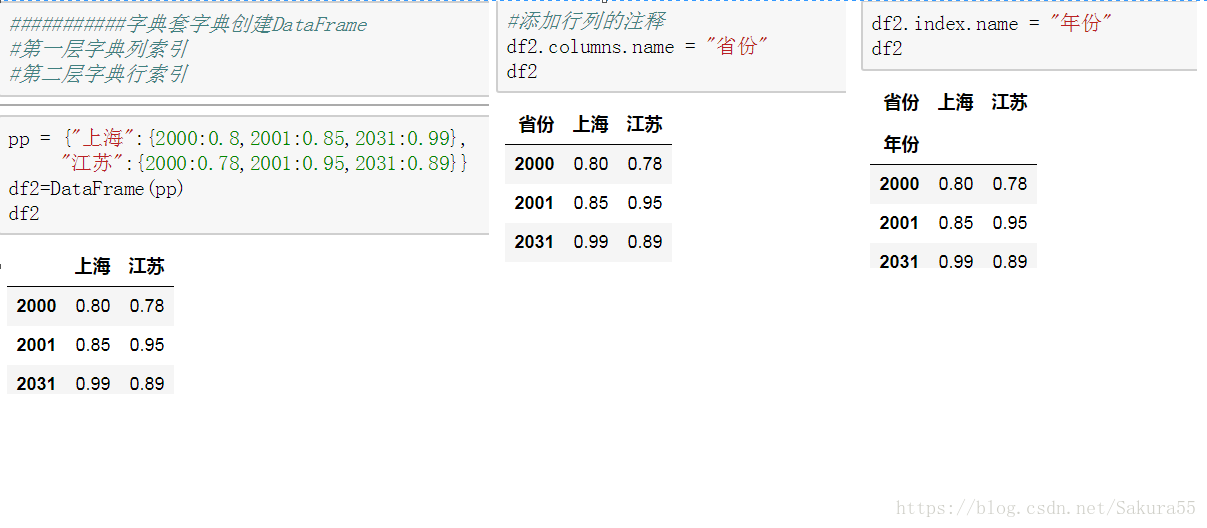
4、数据的运算

from pandas import Series,DataFrame
import pandas as pd
import numpy as np
s1 = Series([2,4.3,43,4.1],index =["a","c","d","e"])
s2 = Series([1,2,3,4,5],index =["a","c","g","f","h"])
s1*s2
###############################
a    2.0
c    8.6
d    NaN
e    NaN
f    NaN
g    NaN
h    NaN
dtype: float64
###############################
df1 = DataFrame(np.arange(9).reshape((3,3)),columns=list("syd"),index=["江苏","南通","上海"])
df2 = DataFrame(np.arange(12).reshape((3,4)),columns=list("styd"),index=["上海","武汉","北京"])
df1
df1+df2
###############################
d   s   t   y
上海  11.0    6.0 NaN 9.0
北京  NaN NaN NaN NaN
南通  NaN NaN NaN NaN
武汉  NaN NaN NaN NaN
江苏  NaN NaN NaN NaN


######表示没有对应的数值则不加,直接填入
df1.add(df2,fill_value=0)


###先进行加法,然后其余NaN的值为0
df1.add(df2).fillna(0)


#获取DataFrame的一行
series = df1.loc["北京"]
series


#DataFrame和Series进行相加或者相减的操作
df1 - series
>>>>>>>
a   d   e
上海  -6  -6  -6
武汉  -3  -3  -3
北京  0   0   0
南通  3   3   3
5、改删及拓展
from pandas import Series,DataFrame
import pandas as pd
import numpy as np
obj = Series(range(3),index = ['a','b','c'])
obj.index = ['c','b','a']#####改索引
#通过切片可以获取到Series索引的多个数据
index[1:]

#修改Series的行索引。。。不支持修改
#删除多列数据
df = DataFrame(np.arange(16).reshape((4,4)),
               index = ["1","2","3","4"],
               columns = ["one","two","three","four"])

#删除DataFrame中指定的索引的数据####################axis = 1 ,删列
df.drop(["one","two"],axis = 1)

#删除DataFrame中指定的索引的数据####################axis = 0 ,删行
df.drop(["1","3"],axis = 0)
6、函数应用及映射
from pandas import Series,DataFrame
import pandas as pd
import numpy as np
df = DataFrame(np.random.randn(4,3),columns = list("dcf"),index = ["1","2","3","4"])
>>>>>>>>>>>>>>>>>>>>>>>>>>>>>>>>>>
d   c   f
1   0.657431    -0.251441   -1.490229
2   2.144438    0.891465    0.199256
3   -2.244726   1.673327    0.637581
4   -0.083177   0.299650    0.498052


np.abs(df)

>>>>>>>>>>>>>>>>>>>>>>>>>>>>>>>>>>
d   c   f
1   0.657431    0.251441    1.490229
2   2.144438    0.891465    0.199256
3   2.244726    1.673327    0.637581
4   0.083177    0.299650    0.498052
求每一列的最大值和最小值的差
#按列
f=lambda x:x.max()-x.min()
df.apply(f)
>>>>>>>>>>>>>>>>>>
d    4.389164
c    1.924768
f    2.127810
dtype: float64
#按行
f=lambda x:x.max()-x.min()
df.apply(f,axis = 1)#映射
>>>>>>>>>>>>>>>>>>>>>>
1    2.147659
2    1.945182
3    3.918053
4    0.581229
dtype: float64
保留小数
##################保留小数
f = lambda x:"%.2f"%x
#对DataFrame中的每一个元素使用函数进行映射
df.applymap(f)#映射
对DataFrame的apply是对整行/整列操作
而applymap是对每一个元素进行操作
#对Series进行map操作(特定的列)
df["d"].map(f)
7、数据的选取和过滤
from pandas import Series,DataFrame
import pandas as pd
import numpy as np
series = Series(np.arange(4),index = ["a","c","b","d"])
series
series[["a","b","c"]]
mask =series<2#花式索引
series[mask]
>>>>>>>>>>>>>>>>>>>>>>>>>
a    0
c    1
dtype: int32

series["c":"d"]###########闭区间
>>>>>>>>>>>>>>>>>>>>>>>>
c    1
b    2
d    3
dtype: int32
8、简单统计函数
求和
from pandas import Series,DataFrame
import pandas as pd
import numpy as np
from numpy import nan as NA
df = DataFrame([[1.4,NA],
              [7.10,-4.5],
              [3,42],
              [6,3.2]],index = list("asdf"),columns=["one","two"])
df.sum() #列
>>>>>>>>>>>>>
one    17.5
two    40.7
dtype: float64

df.sum(axis = 1)  #行
求平均值
df.mean()  #没有值的话不参与计算
>>>>>>>>>>>>>>>>>>>>>>>>>>>>
one    4.25
two   -4.50
dtype: float64

#求平均值
df.mean(skipna=False)  #列中有NaN,则全是NaN
>>>>>>>>>>>>>>>>>>>>>>>>>>>>
one    4.375
two      NaN
dtype: float64

df.mean(axis = 1,skipna=False)  #行中有NaN,则全是NaN

##############全局描述
df.describe()
>>>>>>>>>>>>>>>>>>>>>>>>
one two
count   4.000000    3.000000
mean    4.375000    13.566667
std 2.633597    24.923149
min 1.400000    -4.500000
25% 2.600000    -0.650000
50% 4.500000    3.200000
75% 6.275000    22.600000
max 7.100000    42.000000

#################查看DataFrame数据信息
df.info()
>>>>>>>>>>>>>>>>>>>>>>>>>
<class 'pandas.core.frame.DataFrame'>
Index: 4 entries, a to f
Data columns (total 2 columns):
one    4 non-null float64
two    3 non-null float64
dtypes: float64(2)
memory usage: 256.0+ bytes


#统计一组数据中的每个值的出现频率
obj.value_counts()

#可调用顶级的API方法实现统计一组数据中每个值出现的频率
pd.value_counts(obj.values,sort = False,ascending = True)
#sort按照频率出现的大小次数排序,
#ascending:是否按照升序排序


#isin方法用来判断数据集的数据是否为传入该函数的参数的子集
mask = obj.isin(["c","d"])
mask
>>>>>>>>>>>>>>>>>>>>>>
0     False
1     False
2     False
3      True
4     False
5     False
dtype: bool

obj.unique()  #抽取唯一值
array(['a', 'b', 'd'], dtype=object)
9、索引排序
from pandas import Series,DataFrame
import pandas as pd
import numpy as np
series = Series(np.arange(4),index = list("asdf"))
#######################对Series索引大小进行排序
series.sort_index()
#行索引排序
>>>>>>>>>>>>>>>>>>>>>>>>>>>>
a    0
d    2
f    3
s    1
dtype: int32

######################对DataFrame索引行列进行排序
frame = DataFrame(np.arange(8).reshape((2,4)),index = ["b","a"],columns = list("fdjg"))
frame

>>>>>>>>>>>>>>>>>>

f   d   j   g
b   0   1   2   3
a   4   5   6   7

frame.sort_index()  #行索引排序
frame.sort_index(axis = 1)#列索引排序,默认是升序
>>>>>>>>>>>>>>>>>>
f   d   j   g
a   4   5   6   7
b   0   1   2   3
#若想要降序排列,指定第三个参数
frame.sort_index(axis = 1,ascending = False)
#判断索引是否唯一
series = Series(np.arange(5),index = list("sskkd"))
series.index.is_unique10、value_counts和apply结合
from pandas import Series,DataFrame
import pandas as pd
import numpy as np
from numpy import nan as NA
data = DataFrame({"Qu1":[1,3,4,3,4],
                "Qu2":[2,3,1,2,3],
                "Qu3":[1,5,2,4,4]})
统计每一个值出现的次数
data.apply(pd.value_counts)
---------------------------
Qu1 Qu2 Qu3
1 1.0 1.0 1.0
2 NaN 2.0 1.0
3 2.0 2.0 NaN
4 2.0 NaN 2.0
5 NaN NaN 1.0
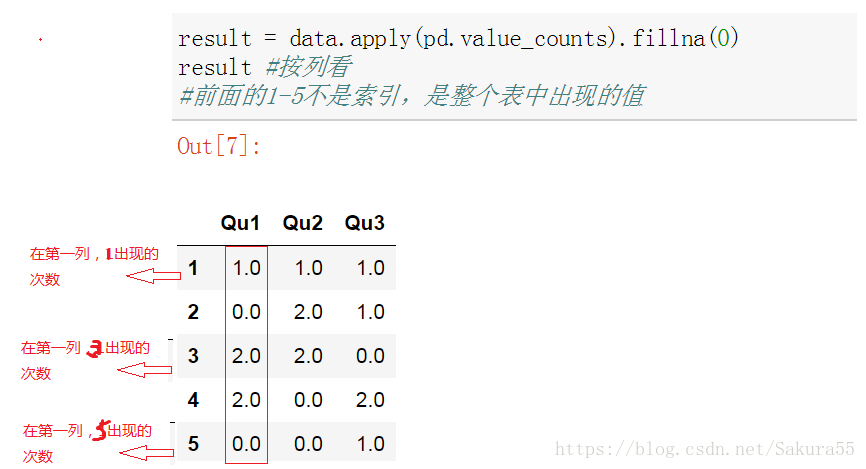
result = data.apply(pd.value_counts).fillna(0)
result #按列看
#前面的1-5不是索引,是整个表中出现的值
---------------------------
Qu1 Qu2 Qu3
1 1.0 1.0 1.0
2 0.0 2.0 1.0
3 2.0 2.0 0.0
4 2.0 0.0 2.0
5 0.0 0.0 1.0
#将花式索引中的数据进行反操作>>>>>>>>>>>>>>>>>~mask
mask = string_data.isnull()
string_data.notnull()
-----------
0     True
1     True
2    False
dtype: bool
11缺失值处理
from pandas import Series,DataFrame
import pandas as pd
import numpy as np
from numpy import nan as NA
data = Series([1,NA,2.5,NA,7])
去除Series的NA
data.dropna()
#通过花式索引筛选非NA值
data[data.notnull()]
去除DataFrame的缺失值
frame = DataFrame([[1.6,5,3],
                 [1,NA,NA],
                 [NA,NA,NA],
                 [2,4,NA]])
frame

clean = frame.dropna()  #只要有NA行都删除行
clean
>>>>>>>>>>>>>>>>>>>>>>>>>>>>>>>>
0   1   2
0   1.6 5.0 3.0


frame.dropna(how="all")  #只删所有数据都是NA的行
>>>>>>>>>>>>>>>>>>>>>>>>>>>>>>>>
0   1   2
0   1.6 5.0 3.0
1   1.0 NaN NaN
3 2.0 4.0 NaNframe.dropna(axis = 1,how="all")#只删所有数据都是NA的列案例
series = Series([5,8,NA,9])
series
>>>>>>>>>>>>>>>>>>>>>>>>>>>>>>>>>
0    5.0
1    8.0
2    NaN
3    9.0
dtype: float64

df[1]=series
>>>>>>>>>>>>>>>>>>>>>>>>>>>>>>>>
0   1   2
0   -0.126735   5.0 0.063372
1   2.068537    8.0 0.726412
2   -0.695149   NaN 0.799249
3   0.743156    9.0 -0.365647

df.fillna(0)
df.fillna({1:99,3:989})
#调用fillna()方法传入字典,前者是列索引,后者是替换NA的值
>>>>>>>>>>>>>>>>>>>>>>>>>>
0   1   2
0   -0.126735   5.0 0.063372
1   2.068537    8.0 0.726412
2   -0.695149   99.0    0.799249
3   0.743156    9.0 -0.365647
df.fillna(0,inplace=True)#####inplace = True参数,则是修改df原数据集
12、字符串操作技术
from pandas import Series,DataFrame
import pandas as pd
import numpy as np
val = "a,d,   dhiashd"
#将字符串分割数组
result = val.split(",")
result
>>>>>>>>>>>>>>>>>>>>>>>>>>>>>>>>>>>>>>
['a', 'd', '   dhiashd']

#去除空格,包含回车换行
newresult = [x.strip() for x in result]
>>>>>>>>>>>>>>>>>>>>>>>>>>>>>>>
['a', 'd', 'dhiashd']

import re
text = "sdad  sdkjs\t ksajd   \tskdjkad"
stra=re.split("\s+",text)
>>>>>>>>>>>>>>>>>>>>>>>>>>>>>>>>>>>>>
['sdad', 'sdkjs', 'ksajd', 'skdjkad']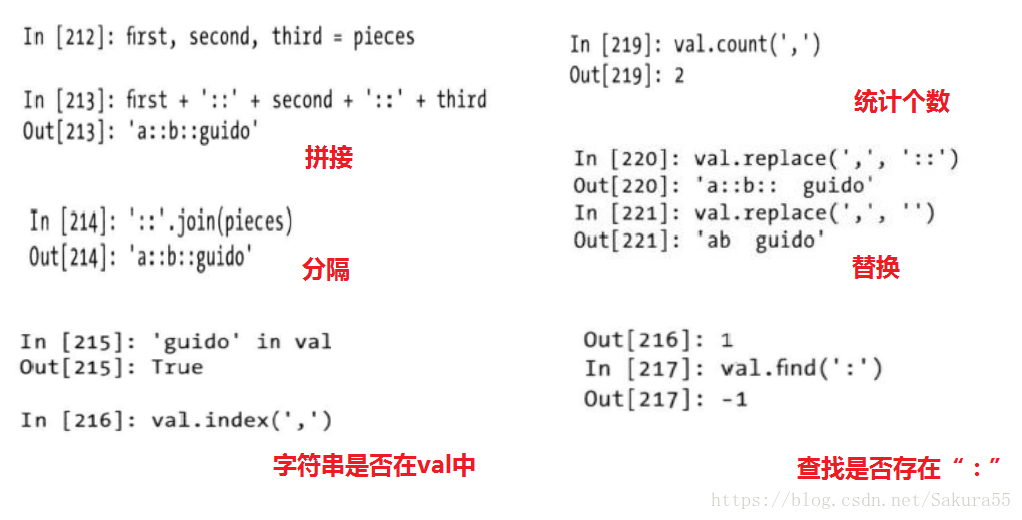
| 方法 | 说明 |
|---|---|
| Count | 返回子串在字符串中的出现次数(非重叠) |
| Endswith,startswith | 如果字符串以某个后缀结尾(以某个前缀幵头),则返回True |
| join | 将字符串用作连接其他字符串序列的分隔符“#”.join(str1):对字符串用“#”连接 |
| Index | 如果在字符串中找到子串,则返回子串第一个字符所在的位置。如果没有找到,则引发ValueError。 |
| Find | 则返回发现的第一个字符所在的位置。如果没有找到,则返回-1 |
| Rfind | 则返回发现的最后一个字符所在的位置。如果没有找到,则返回-1 |
| replace | 用另一个字符串替换指定子串 |

13、时间序列
通常用的日期转化方法
from datetime import datetime
from datetime import timedelta
from dateutil.parser import parse

#获取当前时间
now = datetime.now()
now.year,now.month,now.day
'''(2018, 6, 22)'''

deltatime=datetime(2011,2,5) - datetime (2009,2,6,8,19)
'''datetime.timedelta(728, 56460)'''

start = datetime(2013,2,4)
start + timedelta(12) #天数
'''datetime.datetime(2013, 2, 16, 0, 0)'''
###时间日期类型和字符串之间转换
stamp = datetime.now()
str(stamp)
'''2018-06-22 09:31:52.503876'''

#将时间日期转化为指定的格式
stamp.strftime("%Y-%m-%d")
''''2018-06-22'
'''

#将字符串转化为时间日期类型
datestr = "2014-6-22"
mydate = datetime.strptime(datestr,"%Y-%m-%d")
mydate
'''datetime.datetime(2014, 6, 22, 0, 0)'''

datestr2 = ["2014-6-24","2013-2-22"]
#通过列表推导式穿件时间日期
result = [datetime.strptime(x,"%Y-%m-%d") for x in datestr2]#分隔符要一致

parse("Jan 31 1002 10:23 PM")
'''datetime.datetime(1002, 1, 31, 22, 23)'''

#通过datefirst参数指定第一数值的日期还是月份
parse("2/4/1042",dayfirst = True)###True是指定后者是月份
'''datetime.datetime(1042, 4, 2, 0, 0)'''
用pandas将字符串转化为日期
from pandas import Series,DataFrame
import pandas as pd
import numpy as np
#字符串形式的日期列表
datestr = ["7-6-2032","5-2-2021"]
#用pandas将字符串转化为日期的时间序列
pd.to_datetime(datestr)
idx =pd.to_datetime(datestr+[None])
#NaN   not a number
#NaT   not a time
'''DatetimeIndex(['2032-07-06', '2021-05-02', 'NaT'], dtype='datetime64[ns]', freq=None)'''

#用panda获取时间日期一组数据
idx[1]

#判断pandas时间序列中的值是否是NaT
mask = pd.isnull(idx)
mask
'''array([False, False,  True])'''

idx[~mask]
'''DatetimeIndex(['2032-07-06', '2021-05-02'], dtype='datetime64[ns]', freq=None)'''
用pandas创建日期的时间序列
from pandas import Series,DataFrame
import pandas as pd
import numpy as np
from datetime import datetime
from datetime import timedelta
dates = [datetime(2011,1,2),datetime(2011,1,3),datetime(2011,1,4),
        datetime(2011,1,5),datetime(2011,1,6),datetime(2011,3,20)]
ts = Series(np.random.randn(6),index = dates)
ts
'''2011-01-02    0.255316
2011-01-03   -1.021491
2011-01-04   -0.822556
2011-01-05    0.240472
2011-01-06   -0.683786
2011-03-20    0.016252
dtype: float64'''
####读取
stamp = ts.index[2]
ts[stamp]
ts["20110105"]
ts["2011-1"]

#通过pd.date_range()方法创建一组时间日期序列
long_str = Series(np.random.randn(1000),index = pd.date_range("1/2/2000",periods=1000))
long_str

#只获取2001年的数据
long_str['2001']

#创建指定范围内的数据
index = pd.date_range("4/1/2012","5/1/2012")
print(index)
'''DatetimeIndex(['2012-04-01', '2012-04-02', '2012-04-03', '2012-04-04',
               '2012-04-05', '2012-04-06', '2012-04-07', '2012-04-08',
               '2012-04-09', '2012-04-10', '2012-04-11', '2012-04-12',
               '2012-04-13', '2012-04-14', '2012-04-15', '2012-04-16',
               '2012-04-17', '2012-04-18', '2012-04-19', '2012-04-20',
               '2012-04-21', '2012-04-22', '2012-04-23', '2012-04-24',
               '2012-04-25', '2012-04-26', '2012-04-27', '2012-04-28',
               '2012-04-29', '2012-04-30', '2012-05-01'],
              dtype='datetime64[ns]', freq='D')'''

#指定pd.datw_range()的开始和结束日期闯将时间序列
##往后退
dateindex = pd.date_range(start = "4/2/2013",periods = 20)
dateindex
'''DatetimeIndex(['2013-04-02', '2013-04-03', '2013-04-04', '2013-04-05',
               '2013-04-06', '2013-04-07', '2013-04-08', '2013-04-09',
               '2013-04-10', '2013-04-11', '2013-04-12', '2013-04-13',
               '2013-04-14', '2013-04-15', '2013-04-16', '2013-04-17',
               '2013-04-18', '2013-04-19', '2013-04-20', '2013-04-21'],
              dtype='datetime64[ns]', freq='D')'''

#######往前推
dateindex = pd.date_range(end = "4/2/2013",periods = 20)
dateindex