This article was first published on the Nebula Graph Community public account
background
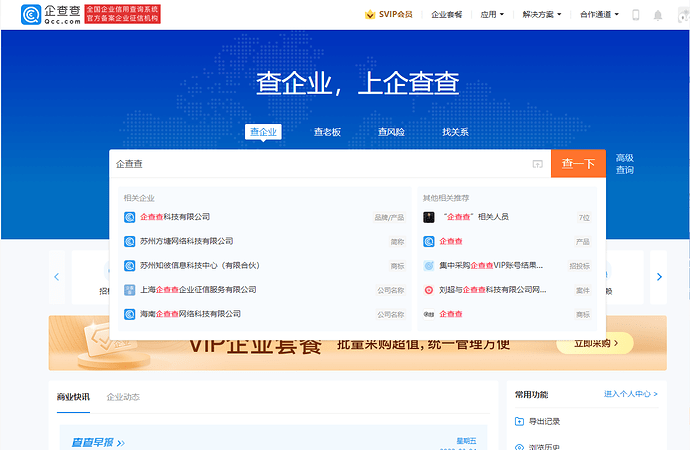
Qichacha is an enterprise credit query tool under Qichacha Technology Co., Ltd., which aims to provide users with quick query of enterprise industrial and commercial information, court judgment information, affiliated company information, legal proceedings, untrustworthy information, information of the person subject to execution, knowledge Property rights information, company news, corporate annual reports and other services.
In order to better display the legal proceedings, risk information, equity information, directors, supervisors, and high-level legal information between enterprises, we extract structured/unstructured enterprise data to construct an enterprise knowledge map to provide users with authentic and reliable services.
Graph database selection
In the beginning, we used Neo4j HA cluster as storage side. With the continuous expansion of data and business scale, we need a distributed graph database with good read and write performance as support . After several investigations, I chose among Dgraph, Nebula, Galaxybase, and HugeGraph, and finally chose Nebula Graph .
Regarding the dimension of selection , we relatively focus on community activity, the difficulty of data acquisition, and the most basic reading and writing, subgraph query performance , etc.
Because the specific evaluation is not as detailed as the articles shared by other users in the community, it will not be expanded here. Here is a link to the previous evaluation of Meituan: Meituan Portal .
Introduction to Nebula Graph
What is Nebula Graph
Nebula Graph is an open source, distributed, and easily scalable native graph database, capable of carrying extremely large datasets with hundreds of billions of points and trillions of edges, and providing millisecond-level queries.

The features of graph database are based on Nebula Graph written in C++, which can provide millisecond-level query. Among many databases, Nebula Graph has shown excellent performance in the field of graph data services. The larger the data scale, the greater the advantages of Nebula Graph.
Nebula Graph adopts a shared-nothing architecture, which supports expansion and contraction without non-stop database services.
Nebula Graph has opened up more and more native tools, such as Nebula Studio , Nebula Console , Nebula Exchange , etc. For more tools, you can view the overview of ecological tools.
In addition, Nebula Graph also has the ability to integrate with Spark, Flink, HBase and other products, which greatly enhances its competitiveness in this era full of challenges and opportunities.
The above content comes from the Nebula Graph documentation site
Nebula Graph Architecture
Nebula Graph consists of three services: Graph service, Meta service and Storage service. It is an architecture that separates storage and computing.
Each service has executable binaries and corresponding processes that users can use to deploy a Nebula Graph cluster on one or more machines.
The figure below shows the classic architecture of a Nebula Graph cluster.
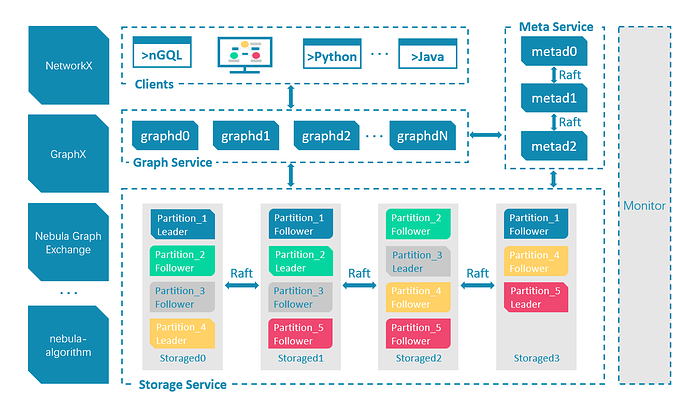
The above content comes from the Nebula Graph documentation site
Process Optimization
Data Import of Nebula Graph
In the early days of our exposure to Nebula Graph, the surrounding tools were not perfect. We import Nebula Graph data in full or incrementally by using Hive tables to push to Kafka, and consume Kafka to write to Nebula Graph in batches . Later, as more and more data and business switched to Nebula Graph, it was found that there are three major problems in the current method:
- The time for full import has increased to an unacceptable level
- Incremental data consumption due to multiple partitions in Kafka, some timing cannot be guaranteed
- How to reduce the deviation of the overall data after the incremental data enters the Nebula Graph after a long time
In response to the above problems, we make different optimization schemes according to the business characteristics of each Space, due to the different real-time requirements.
- After trying the Nebula Spark Connector and Nebula Importer, considering the ease of maintenance and migration,
hive table -> csv -> nebula server -> importerthe to import in full, and the overall time-consuming is also greatly improved. - After splitting, the test merges the increments from multiple partitions into one partition for consumption. This will not affect the real-time performance, and the real-time error can be guaranteed within 1min, which is acceptable.
- Set the TTL attribute for different fields, import full correction data regularly, and supplement the data during the full import period to avoid data overwriting.
Service failure discovery
At present, we have upgraded to v2.6.1. There are some bugs in the original v1 and v2.0.1. It is often easy to cause OOM to cause graph down. At that time, in order to reduce the impact of graph down as much as possible, relevant scripts were made to monitor the process, and if there was a downtime, it would be restarted immediately.
In addition, in order to improve the availability of the overall service, the cluster nodes CPU, 内存, 硬盘, TCPetc., are monitored and alarmed accordingly. Some indicators of the Nebula Graph service layer are also connected to Grafana . The more important alarm indicators are as follows:
nebula_metad_heartbeat_latency_us_avg_60 > 200000

nebula_graphd_num_slow_queries_rate_60 > 60
nebula_graphd_slow_query_latency_us_avg_60 >400000
nebula_graphd_slow_query_latency_us_p95_60 > 900000

nebula_graphd_num_query_errors_rate_60 > 10

nebula_storaged_add_edges_latency_us_avg_60 > 90000
nebula_storaged_add_vertices_latency_us_avg_60 > 90000
nebula_storaged_delete_edges_latency_us_avg_60 > 90000
nebula_storaged_delete_vertices_latency_us_avg_60 > 90000
nebula_storaged_get_neighbors_latency_us_avg_60 > 200000
At the same time, the application layer 接口does 慢查询and 流量monitors alarms:
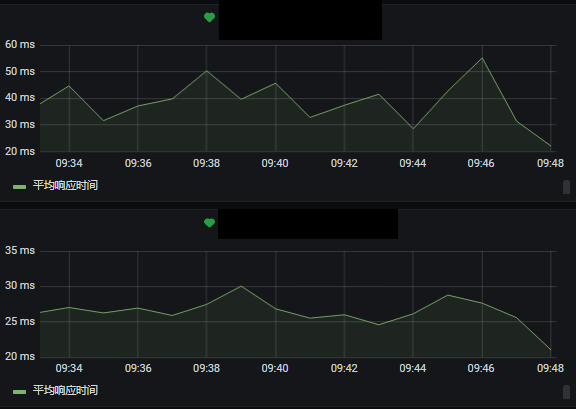
Later, Nebula officially launched the Nebula Dashboard for monitoring indicators in various aspects, but it seems that there is no alarm for the time being (the enterprise version has an alarm function).
After the previous introduction, the basic framework process of Nebula Graph on our side is as follows:
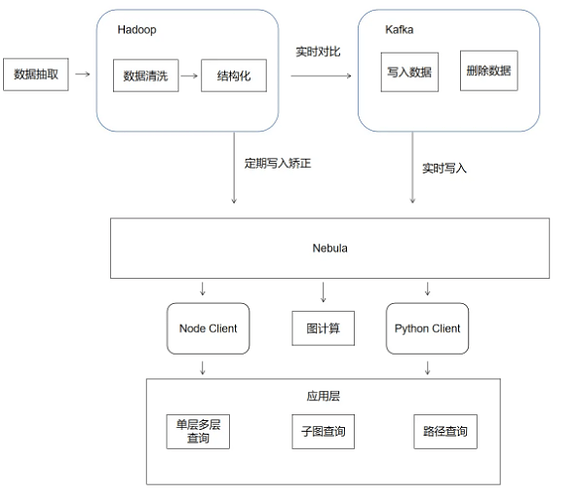
Nebula Graph's classic business in Qichacha
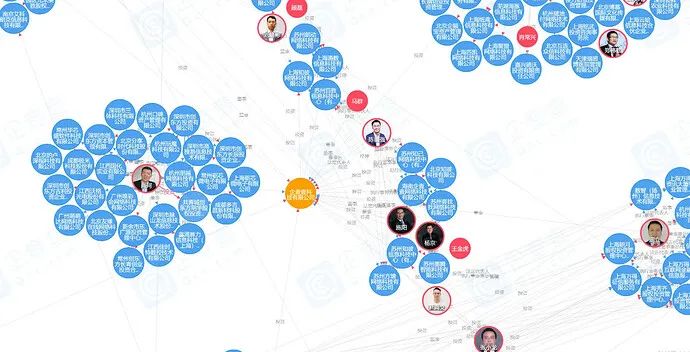
- Sub-graph query business requirements: Display the corporate relationship within two hops of a company/person (for example: Director, Supervisor, Gao Fa), and display it visually in the form of a graph. For more and more detailed information, you can visit the official website of Qichacha. There are more and more comprehensive enterprise/individual relationship maps, risk maps, and shareholder relationship penetration. portal
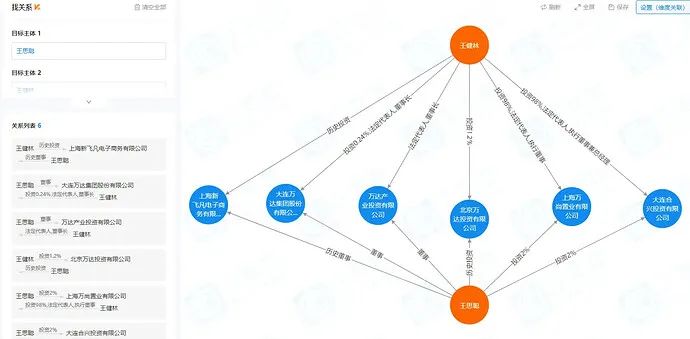
- Find relationship business requirements: Find the relationship between any two or more entities (company or people), including but not limited to directors, supervisors, high law, holdings, historical directors, supervisors, high law, and historical holdings. Unfortunately, Nebula Graph's current official path query, after several rounds of cross-comparison tests, found that the performance loss after the cut was large, and it was temporarily unable to meet business needs. We have not yet switched from Neo4j to Nebula Graph, and have raised an issue after many communications .
enhancement listCurrently looking forward to the official optimization in , we will continue to follow up.
Outlook
Nebula currently provides super literacy and rich ecology, as well as excellent community activity and official support. However, the complex query expression ability, path finding and node filtering still need to be strengthened. We hope that the community will become stronger and stronger, and related functions will be improved as soon as possible. We also conveniently switch to Nebula Graph without having to maintain two sets of databases.
Exchange graph database technology? To join the Nebula exchange group, please fill in your Nebula business card first , and the Nebula assistant will pull you into the group~~
Pay attention to the public account