Identification and optimal selection of temperature-sensitive measuring points for thermal error compensation of heavy-duty machine tools
Motivation and main contributions
● The performance of thermal error prediction mainly depends on the accuracy and robustness of the prediction model and the input temperature variables
● In the thermal error compensation scheme of large CNC machine tools, due to the complex structure and heating mechanism of temperature sensitive points, there is still no effective Method for identifying temperature sensitive points
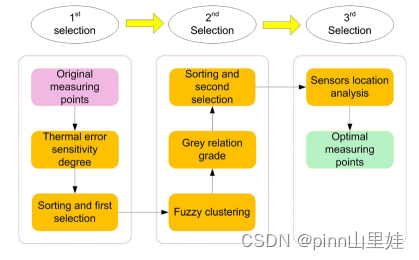
● This paper proposes an optimal method for temperature sensitive measuring points. The optimal measuring point is obtained through three steps. First, the temperature sensitivity is defined and used to select measurement points with high sensitivity to thermal errors. Then use fuzzy clustering and gray relational degree to classify the selected first point. Finally, through the analysis of the position of the temperature sensor, the temperature-sensitive measuring point is selected. The
experiment is carried out on the flexible machining center CR5116. The results show that: this method can reduce the number of measuring points from 27 to 5. The thermal error compensation model for sensitive measuring points has the best predictive effect
method
• On the first selection, sort the temperature variable by thermal error sensitivity to generate a new sequence. Select the measurement points in the first half of the sequence for further analysis.
● In the second selection, calculate the gray correlation degree between the first selected measuring points and thermal error, and then use fuzzy clustering to divide these measuring points into different groups. By selecting the point with the largest gray correlation degree in each group, the second set of measurement point sequences is obtained.
● In the third selection, the sequence of the second selection will be analyzed in conjunction with the position of the sensor.
Part I
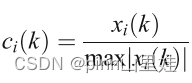
The thermal error sensitivity indicates the degree of influence of temperature changes on the thermal error. Define the thermal error sensitivity coefficient as
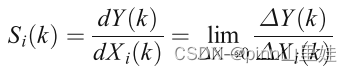
where Y is the thermal error and x is the temperature data.
The larger the gi value, the more sensitive the temperature measuring point
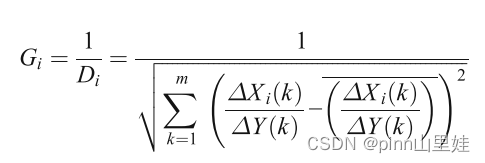
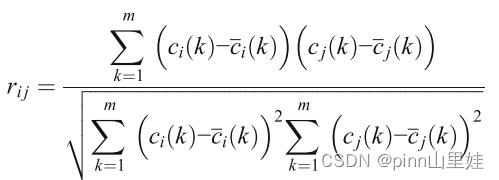
gray correlation analysis
The gray correlation coefficient is

The gray correlation is defined as
fuzzy clustering
The standardized
fuzzy similarity matrix is defined as R, where the elements
Calculate the similarity and equivalence matrix, and then set the threshold for classification
experiment

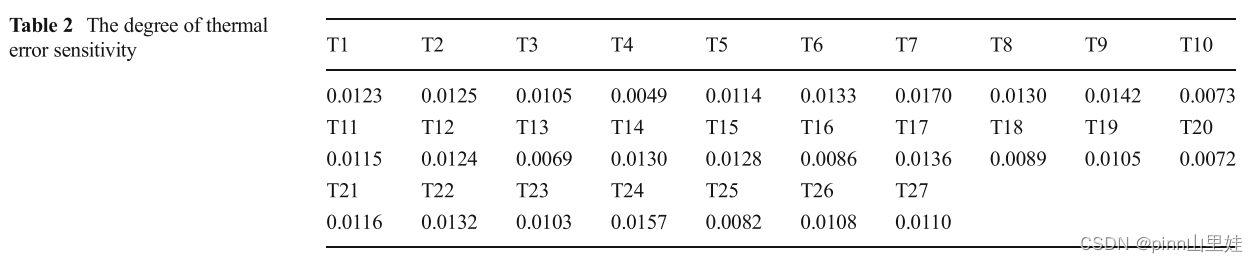
● According to the sensitivity in Table 2, the previous 14 measuring points T1, T2, T6, T7, T8, T9, T11, T12, T14, T15, T18, T22, T23, T25 are selected, and other points are discarded
● Use fuzzy clustering to classify the remaining 14 measuring points. Under different thresholds, the temperature variable can be divided into 6, 7, and 8 groups. The third step is to calculate the gray correlation degree between the temperature variable and the thermal error. After the results are sorted, Table 3 is obtained, and the second selected point is obtained by classification
r1=[T2 T6 T12 T14 T23 T25], r2=[T2 T6 T7 T12 T14 T23 T25], and r3=[T2 T6 T7 T12 T14 T23 T25]
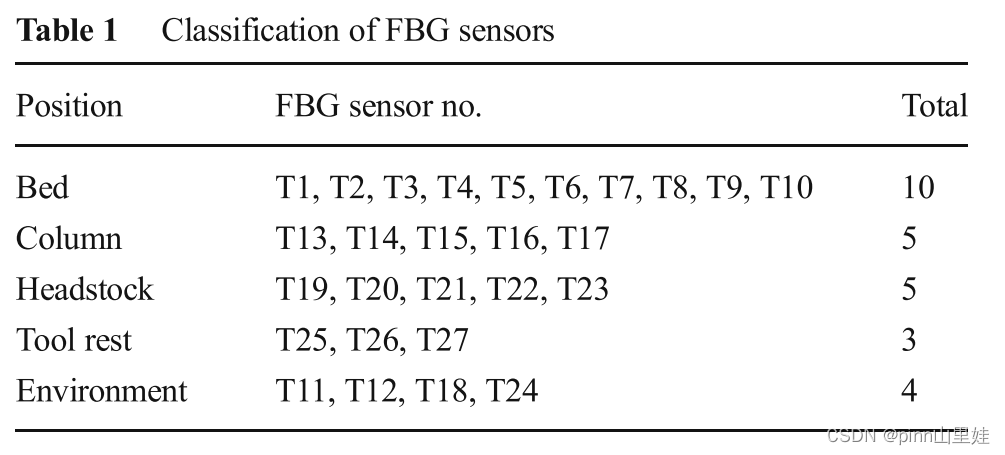
• The third option is based on the location of the FBG sensor. As shown in Table 1, the temperature measuring points are divided into five groups. Only one measurement point is selected for each group. In order to eliminate the coupling between temperature variables, select the variable with the largest gray correlation,
e1 = [ T6 T 1 2 T14 T23 T25], e2 = e3=[T7 T12 T14 T23 T25].
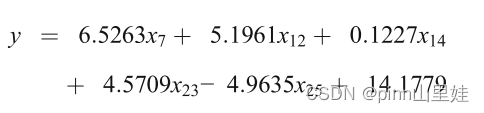
Since T7 has a larger gray correlation than T6 So choose e2, e3 can be
The final prediction model can be selected
Summarize
- The first step is to determine the degree of temperature sensitivity, and realize a measurement point according to the degree of temperature sensitivity.
- The second step combines gray theory with fuzzy clustering. In this step, fuzzy cluster classification is first performed on the selected measuring point, the second measuring point is selected, and the gray value of each temperature is compared, finally, the best one is selected by considering the position of the FBG sensor temperature measurement point.