
This quote from Charity Majors probably best sums up the current state of observability in the tech industry—complete, massive chaos. Everyone is confused. What is trace? What is span? Is a log line a span? If I have logs, do I still need to trace? If I have good metrics, why do I need trace? The list goes on and on. Charity, along with other great minds in Honeycomb observable systems, has been working hard to solve these problems. However, based on my own experience, it's still hard to explain what Charity means when she says "logs are garbage", let alone that logging and tracing are essentially the same thing. Why is everyone so confused?
At a slight risk, I'm going to blame Open Telemetry. Yes, it's the powerhouse of the modern observability stack, yet I blame it for the mess. That's not because it's a bad solution - it's brilliant! However, its introduction and explanation of the concepts and functions of Open Telemetry make observability look tricky and complicated.
First, Open Telemetry clearly distinguishes between traces, metrics, and logs from the beginning:
OpenTelemetry is a collection of APIs, SDKs, and tools. Use it to instrument, generate, collect, and export telemetry data (metrics, logs, and traces) to help you analyze your software's performance and behavior. collection. Use it to detect, generate, collect, and export telemetry data (metrics, logs, and traces) to help you analyze your software's performance and behavior.
Then explain each of these 3 questions further in depth.
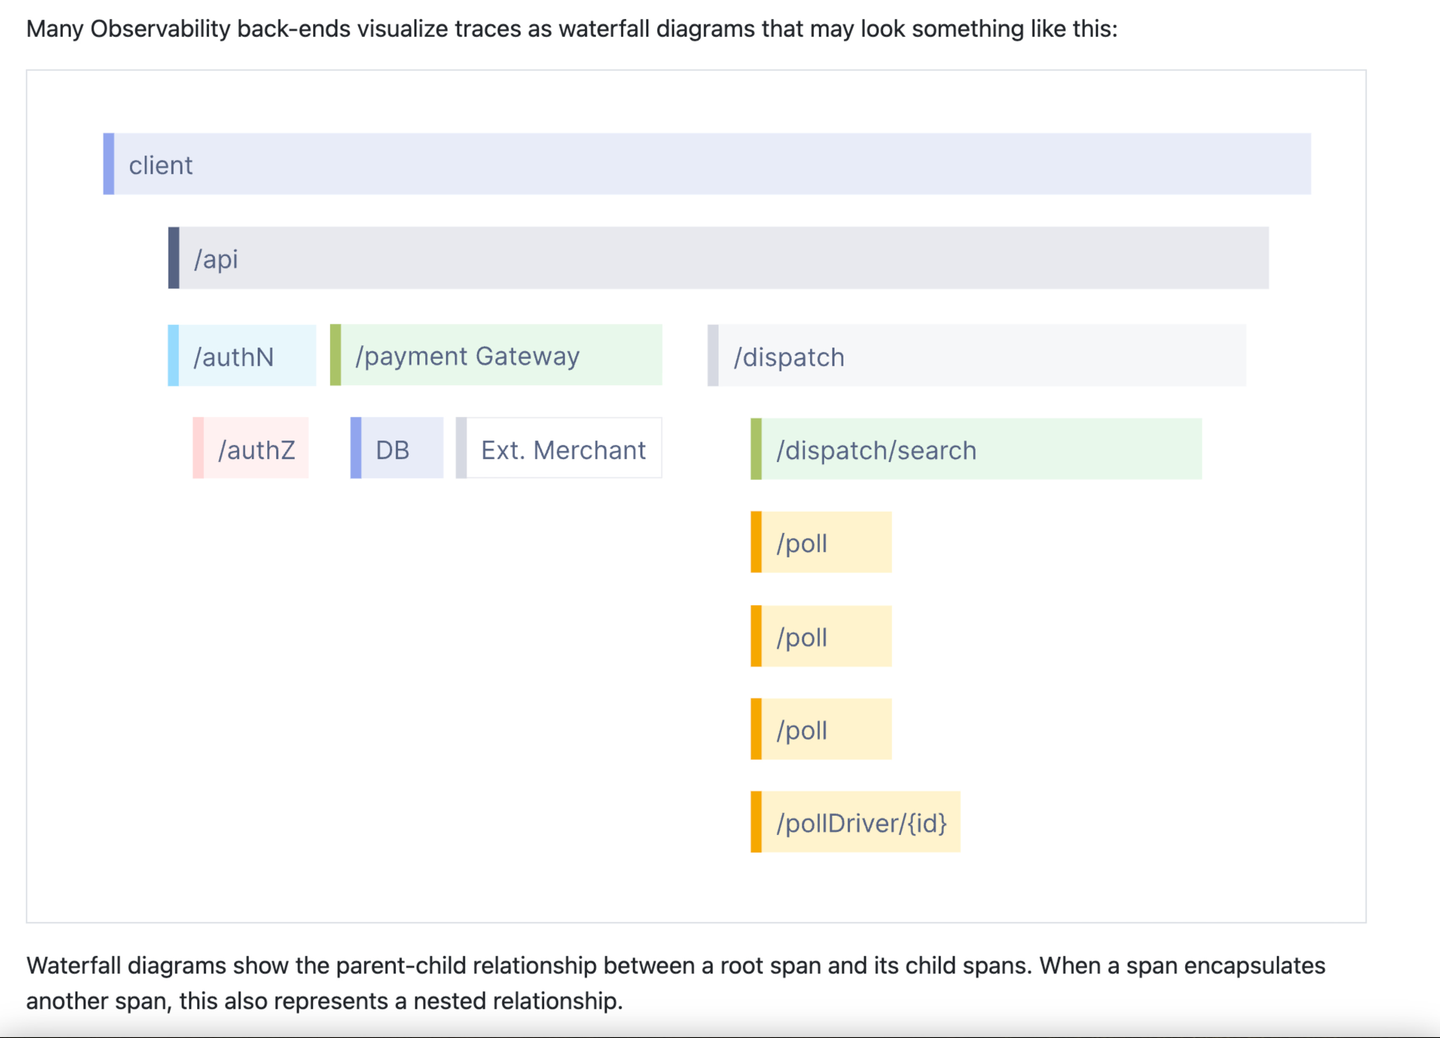
This is a partial screenshot of the trace introduction on the OpenTelemetry website. In my experience talking to OpenTelemetry staff, this presentation has really become one of the main pictures related to observability. For some, this is observability. It also distinguishes trace from anything else. This is obviously not a log, right? This doesn’t look like an indicator either, right? This is something special, maybe a bit awesome, and requires dedication to learning. In my experience, once people understand traces, they only think of them in the context of this picture and related terms like span, root span, nested span, etc. The OpenTelemetry website has a glossary page with over 60 terms ! It's all extremely complicated!
But more importantly – does this focus on “logs, metrics and link traces” represent the true power of observability? Sure, it does cover some scenarios, but when it comes to large-scale distributed systems, it's more important to be able to dig deep into the data - "slice and dice" it, build and analyze various views, make correlations Sexual analysis, searching for anomalies... and systems that provide all these capabilities do exist.
Scuba: Observability Paradise
When I worked at Meta, I didn't realize that I was lucky enough to be working with the best observability system ever created. This system is called Scuba, and it's the number one thing people miss most after leaving Meta Corporation.
The basic idea of Scuba is simple enough that one doesn't need to read pages of terminology to understand it. It uses Wide Events. A generalized event is just a collection of fields with names and values, just like a JSON document. If you need to log some information - whether it's the current state of the system or caused by an API call, background job or other event - you just write some generalized events to Scuba. For example, if a system serves advertising, it will naturally want to record ad impressions - that is, the fact that an ad was seen by a user. The corresponding generalized event might look like this:
{
    "Timestamp": "1707951423",
    "AdId": "542508c92f6f47c2916691d6e8551279”,
    "UserCountry": "US",
    "Placement": "mobile_feed",
    "CampaingType": "direct_ads",
    "UserOS": "Android",
    "OSVersion": "14",
    "AppVersion": "798de3c28b074df9a24a479ce98302b6",
    "...": ""
}
Such events are called generalized events because all conceivable information is encouraged to be stored in them. Anything that might be relevant in the context of that particular data - just put it out there and it might be useful later. This approach lays the foundation for dealing with the unknown unknowns - things that cannot be thought of now that might be revealed during an accident investigation.
Dealing with unknown unknown situations can be better illustrated with an example. Scuba has an intuitive and user-friendly interface that makes it easy to explore and operate. It has a section to select which metrics to view, and sections for filtering and grouping - Scuba will plot a nice time series chart. A first look at the ad impressions dataset will simply plot a graph containing the number of impressions:
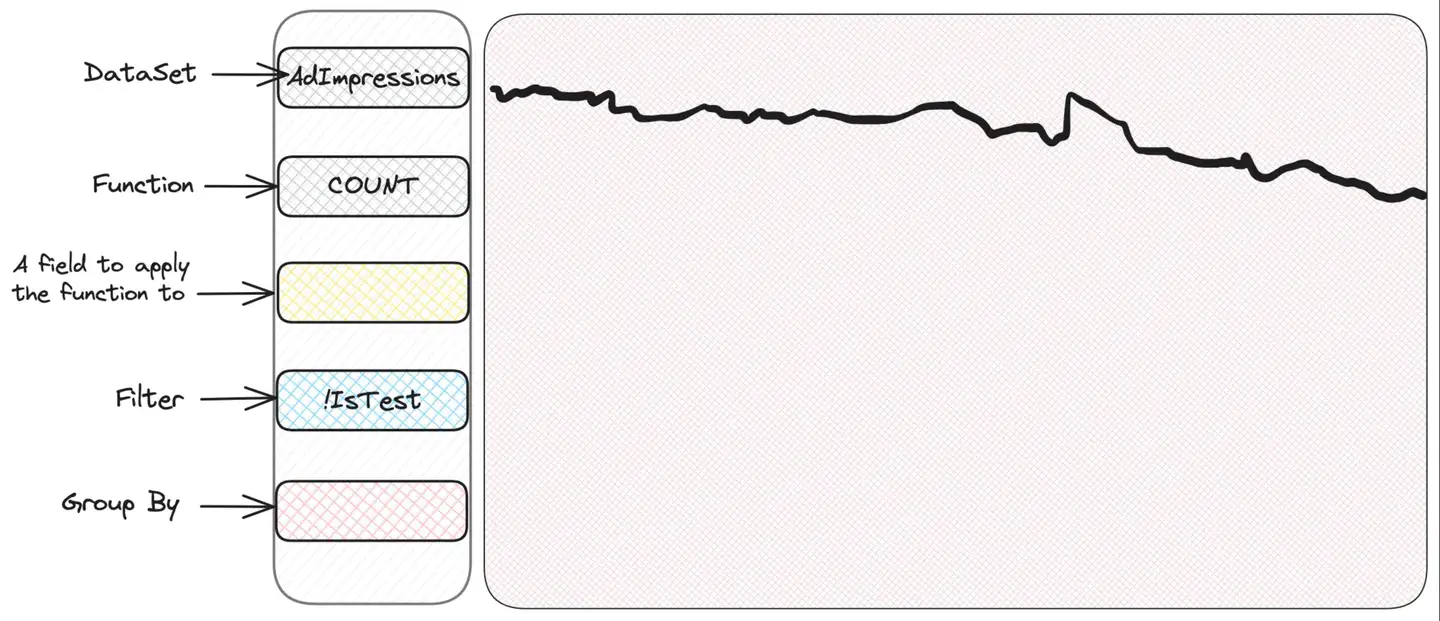
If we expressed in SQL what exactly is selected here, then this would be like:
SELECT COUNT(*) FROM AdImpressions
WHERE IsTest = False
This is not entirely the case. Scuba also features the concept of native sampling. When an event is written to Scuba, a field called , which represents the sampling rate of this particular event, must also be written. Scuba uses this information to correctly "zoom in" to the results displayed on the chart, so there is no need to do this magnification in your head. This is a great concept because it allows for dynamic sampling - for example, a certain type of presentation might be sampled more frequently than another type of presentation, while preserving the "real" values in the UI. So the actual query underneath is: samplingRate
SELECT SUM(samplingRate) FROM AdImpressions
WHERE IsTest = False
Note that the entire "zooming in" is done transparently by the UI and the user does not need to think about it during the query. So let's say some alert occurs and our precious ad impression graph looks weird:
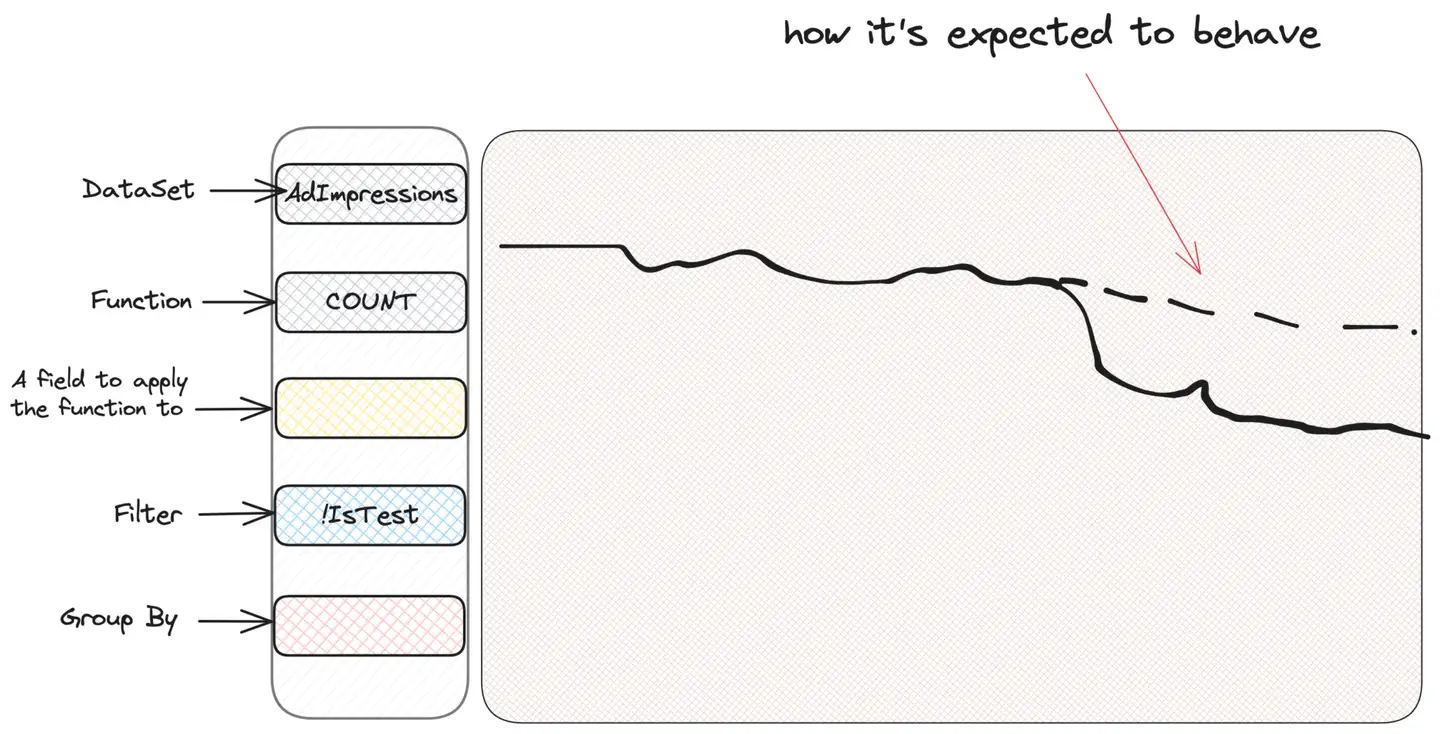
The first instinct of everyone who uses Scuba to investigate is to "slice and dice", i.e. filter or group based on criteria, to see if they can get some information. We don't know what we're looking for, but we believe we'll find it. Therefore, we group by impression type, user country, or ad location until we find something suspicious. Let's assume grouping by campaign type (CampaignType):
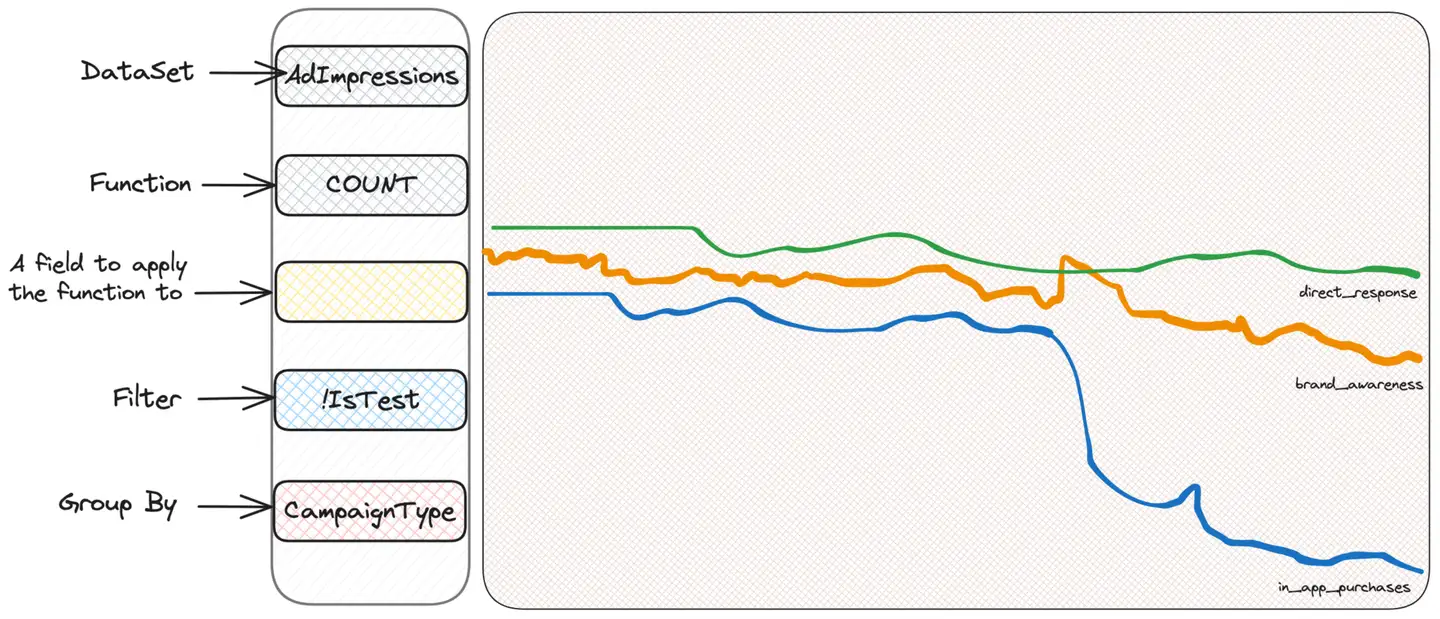
We discovered that a campaign type called in_app_purchases (please note, I made this up) appears to be different from the other types. We don't really know what it means - and we don't need to know! - We just have to keep digging. Okay, now we can filter just these campaigns and continue to group based on other criteria that we can think of. For example, user operating system makes sense.
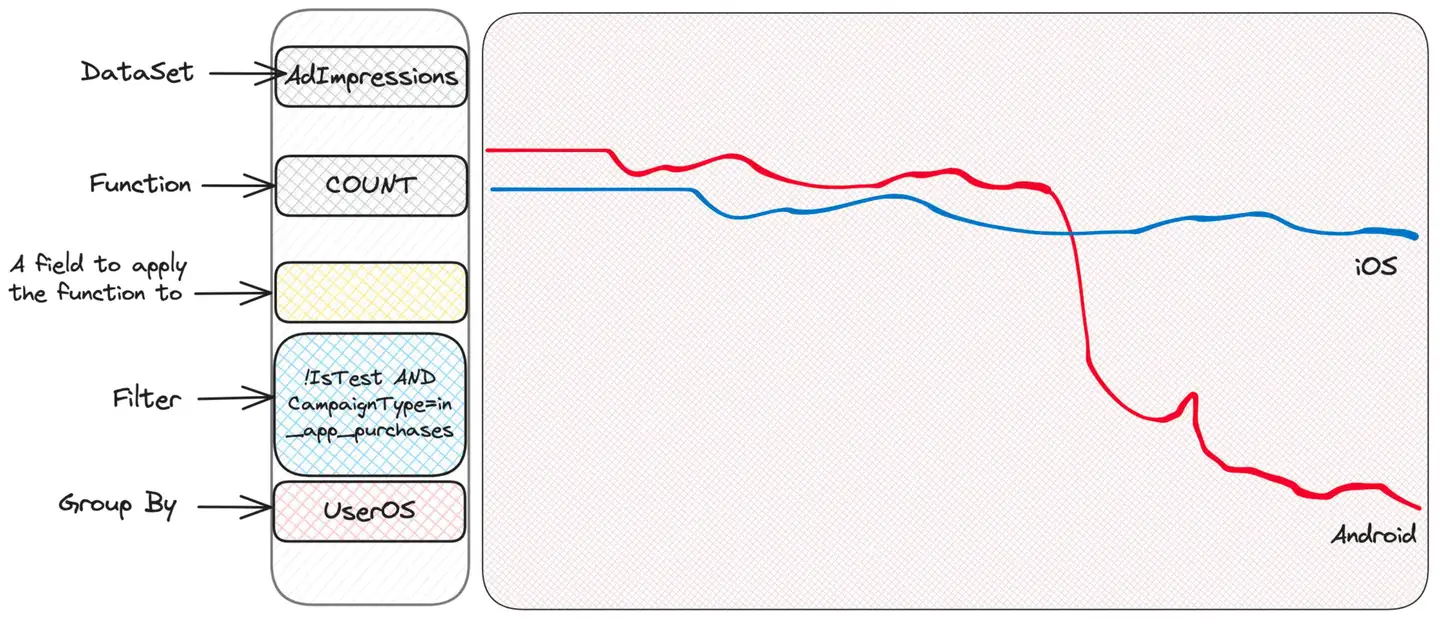
Well, there seems to be a problem with Android. iOS is ok, which suggests the issue may be on the client side - perhaps a buggy version of the app?
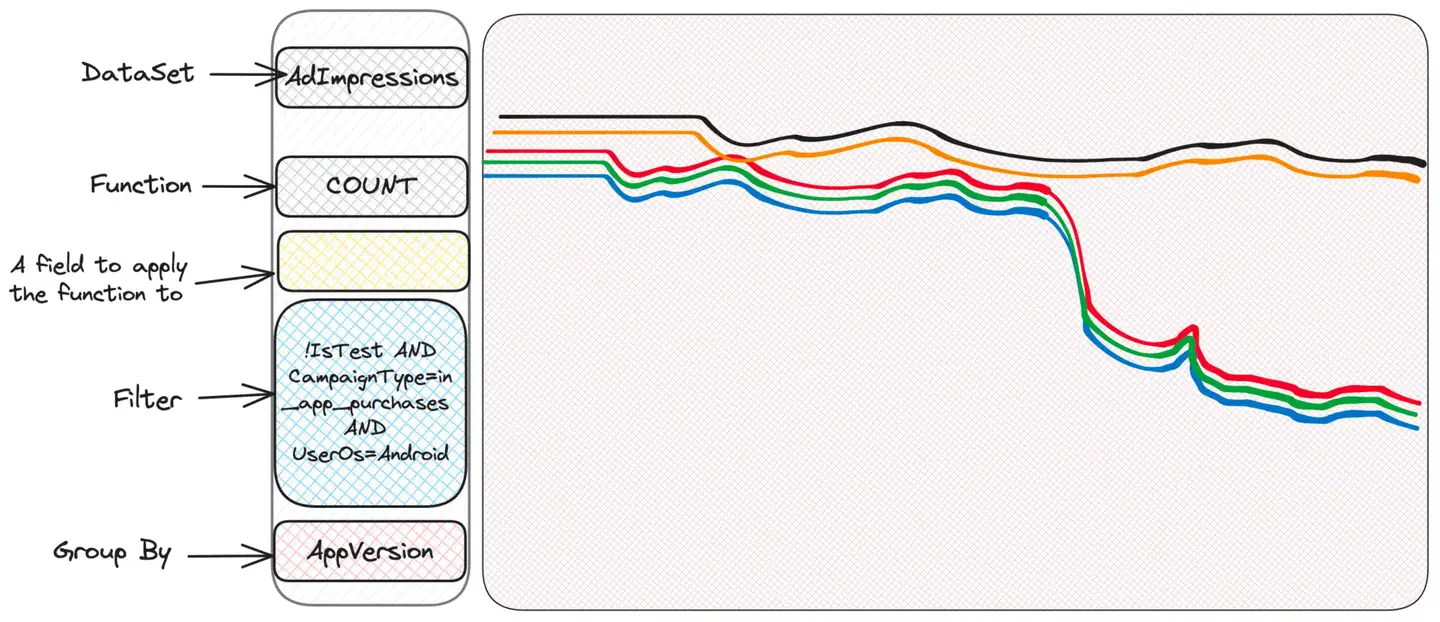
strangeness. Some people have problems, others don't. Maybe check the OS version?
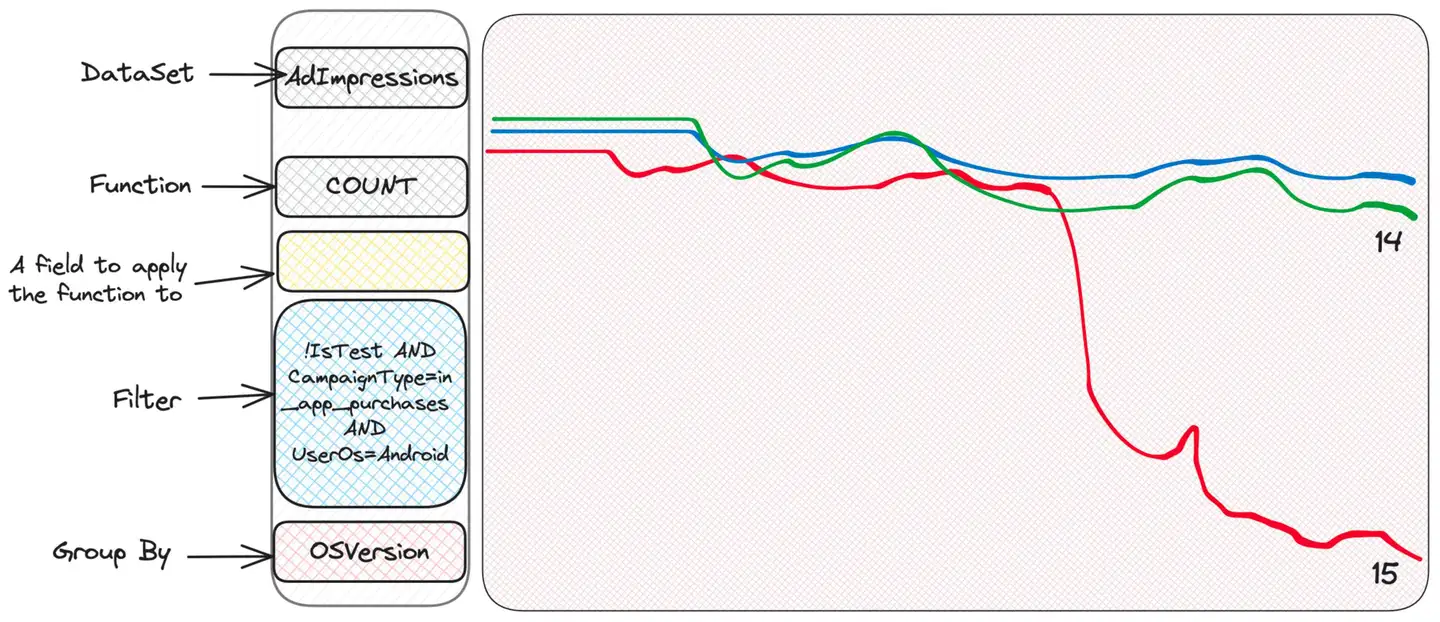
ha! This is the latest OS version and it looks like some app versions don't perform well for this type of campaign on this OS version. Given this information, the dedicated team can now delve deeper.
what happened? Without any knowledge of the system, we have narrowed down the issue and identified the team responsible for further investigation. Could we have known in advance that this strange combination of OS, OS version, campaign type, and app version might cause some issues and had the metrics ready? Of course it's impossible. This is an example of dealing with unknown unknowns. We just store all relevant contextual information in generalized events and use them when needed. Scuba makes exploration easy because it is fast and has a very beautiful and easy-to-use user interface. Also note that we never mentioned anything about cardinality. Because it doesn't matter - any field can have any cardinality. Scuba operates with raw events and does no pre-aggregation, so cardinality is not an issue.
Sometimes the interface/visualization aspect doesn't get enough attention, and the monitoring system provides some query language - maybe proprietary (a particularly bad experience), or SQL (slightly better, but still not good). Such an interface would make it nearly impossible to conduct a similar survey. An important aspect of Scuba is that all fields (functions, filters, groupings, etc.) are explorable. That said, there is an easy way to see the types of values we can select. When the person in charge of a certain data field puts in extra effort to improve the data they are responsible for, they go beyond simply collecting the data. They will even provide a detailed description for the given field, including related links. This is very important. I successfully conducted troubleshooting many times without fully understanding the system as a whole or the data available in that dataset. And during these troubleshooting processes, I learned a lot about the system simply by interacting with Scuba! This is amazing. This is observability heaven.
The pain after leaving Meta
Now imagine my confusion and disbelief when I left Meta and learned about the state of the external observability system.

log? track? index? What exactly is this? Does anyone know about generalized events? Can I not learn the glossary of 60 terms and just...explore stuff?
I spent quite some time mapping the Scuba-based mental model to the Open Telemetry mental model. I realized that Open Telemetry's Span is actually a generalized event. Actually, I'm still not quite sure if I understand it correctly:

If we take the example of an advertising display, this display is not actually an operation, it is just some facts we want to record... To be fair, the concept of events does exist in Open Telemetry:
But if we follow the link and dig deeper, we again find that the event is actually one of the traces, metrics, or logs

But in any case, Span is the closest concept to a generalized event. The problem is - it's hard to defend the mental model proposed by Open Telemetry when you're used to it. This is really frustrating because traces, metrics, and logs are really just special cases of generalized events:
- Traces and spans (Spans): They are just generalized events with SpanId, TraceId and ParentSpanId fields. So we can filter all spans with a given TraceId, sort them topologically based on the relationship SpanId → ParentSpanId, and draw everyone's favorite distributed trace view.
- Logs: To be honest, I'm really confused by what Open Telemetry calls logs. It looks like it contains a lot of things, one of which is structured logging, which is basically wide events. Very good! The problem, however, is that "log" is a fairly well-defined concept, and usually people mean what those calls produce. Anyway, whatever that means, logs can certainly be easily mapped to wide events. In the simplest case, we just take the log message, put it into the "log_message" field, add a bunch of metadata, and be satisfied. In a more complex case, we could try to automatically extract a template from the log message by removing the token that looks like an ID, and get the hash of this template. This allows us to quickly get the most frequent errors, for example, by grouping by this hash. Meta has a system like this, and it's pretty cool.
logger.info(…) - Metrics: Metrics can also be easily mapped. We just need to emit a wide event containing system status (such as CPU system indicators, various counters, etc.) within a certain interval. By the way, Prometheus does exactly this through the scraping method - taking an occasional snapshot of the system. However, unlike Prometheus, using the wide event approach we don't need to worry about cardinality issues.
But Wide Events can provide much more than these "three pillars" (Traces, Logs, Metrics). The aforementioned debugging session is already (at least not naturally) a case covered by Traces, Logs, and Metrics. There may be other use cases - for example, continuous profiling data can be easily represented as a Wide Event and queried to build a Flame Graph. There's no need to have a separate system for this - a single system handling wide events can do it all. Imagine the possibilities for cross-correlation and root cause analysis when everything is stored together, in one place. Especially in the era of the rise of artificial intelligence tools, which are excellent at discovering relationships in data.
So, then?
I don't know... I just wanted to express my disappointment and frustration that observability is so confusing and confusing and focused on what the "three pillars" are...
I just hope that observability vendors will stand up against the chaos and provide a simple and natural way to interact with the system. Honeycomb seems to be doing this, and a few other systems like Axiom are doing this as well. it's great! Hopefully other suppliers will follow suit.
attached
This article is a translation, original text: https:// isburmistrov.substack.com /p/all-you-need-is-wide-events-not-metrics
Please allow me to insert a small advertisement at the end of the article. I have been starting a business for two years, and our company also does observability, which is somewhat similar to the idea of this article. If you have needs in this area, please feel free to contact us for product and technical exchanges.
About Kuaimao Nebula
Kuaimao Nebula is a cloud-native intelligent operation and maintenance technology company. It is composed of the core development team of the well-known open source project "Nightingale". The founding team comes from Internet companies such as Alibaba, Baidu, and Didi. Nightingale is an open source cloud-native monitoring tool. It is the first open source project donated and hosted by the Computer Society of China. It has more than 8,000 stars on GitHub, has released more than 100 iterative versions, and has hundreds of community contributors. It is the leading open source observability solution in China.
The "Flashcat Platform" built by Kuaimao Nebula with the open source Nightingale as the core is the product implementation of observability practices of top domestic Internet companies. It is committed to making observability technology better serve enterprises and ensure service stability. The Flashcat platform has the following features:
- Unified collection: Adopting the plug-in concept, hundreds of built-in collection plug-ins are integrated. Servers, network equipment, middleware, databases, applications, and businesses can all be monitored and used out of the box.
- Unified alarm: supports the docking of dozens of data sources, collects alarm events from various monitoring systems, and performs unified alarm convergence, noise reduction, scheduling, claiming, upgrading, and collaboration, greatly improving alarm processing efficiency.
- Unified observation: Integrate various observability data such as Metrics, Logs, Traces, Events, and Profiling, and preset industry best practices. It not only provides a cockpit from a global business perspective and a technical perspective, but also provides drill-down faults. Positioning capability, effectively shortening fault discovery and positioning time.
Kuaimao Nebula makes observability data more valuable!
https://flashcat.cloud/