Author introduction: Zhang Ji, engaged in training optimization of Soutui/LLM, focusing on system bottom layer/network optimization.
background
随着大型模型的参数量从十亿量级跃升至万亿级别,其训练规模的急剧扩张不仅引发了集群成本的显著上涨,还对系统稳定性构成了挑战,尤其是机器故障的频发成为不可忽视的问题。对于大规模分布式训练任务而言,可观测性能力成为了排查故障、优化性能的关键所在。所以从事大型模型训练领域的技术人,都会不可避免地面临以下挑战:
- During the training process, performance may be unstable, fluctuate or even decline due to various factors such as network and computing bottlenecks;
- Distributed training involves multiple nodes working together. If any node fails (whether it is a software, hardware, network card or GPU problem), the entire training process needs to be suspended, seriously affecting training efficiency and wasting precious GPU resources.
However, in the actual large model training process, these problems are difficult to troubleshoot. The main reasons are as follows:
- The training process is a synchronous operation, and it is difficult to rule out which machines have problems at this time through overall performance indicators. A slow machine can slow down the overall training speed;
- Slow training performance is often not a problem with the training logic/framework, but is usually caused by the environment. If there is no training-related monitoring data, printing timelines actually has no effect, and the storage requirements for storing timeline files are also high;
- The analysis workflow is complex. For example, when training hangs, you need to complete the printing of all stacks before the torch times out and then analyze them. When facing large-scale tasks, it is difficult to complete within the torch timeout.
In large-scale distributed training operations, observable capabilities are particularly important for troubleshooting and performance improvement. In the practice of large-scale training, Ant developed the xpu_timer library to meet the observability requirements of AI training. In the future, we will open source xpu timer into DLRover. Everyone is welcome to cooperate and build together:) The xpu_timer library is a profiling tool that intercepts the cublas/cudart library and uses cudaEvent to time the matrix multiplication/set communication operations in training. , it also has functions such as timeline analysis, hang detection, and hang stack analysis, and is designed to support a variety of heterogeneous platforms. This tool has the following features:
- There is no intrusion into the code, no loss in training performance, and it can be resident in the training process;
- Indifferent to users and irrelevant to the framework
- Low loss/high accuracy
- Indicator aggregation/delivery can be performed to facilitate further processing and analysis of data;
- High efficiency of information storage
- Convenient interactive interface: Provides a friendly external interface to facilitate integration with other systems and direct user operation, accelerating the insight and decision-making process.
Design
First, to address the issue of training hangs/performance degradation, we designed a permanent kernel timing:
- In most scenarios, training hangs are caused by nccl operations. Usually, you only need to record matrix multiplication and set communication;
- For performance degradation on a single machine (ECC, MCE), you only need to record the matrix multiplication. At the same time, analyzing the matrix multiplication can also check whether the user's matrix shape is scientific and maximize the performance of tensorcore. Each framework directly uses cublas when implementing matrix multiplication.
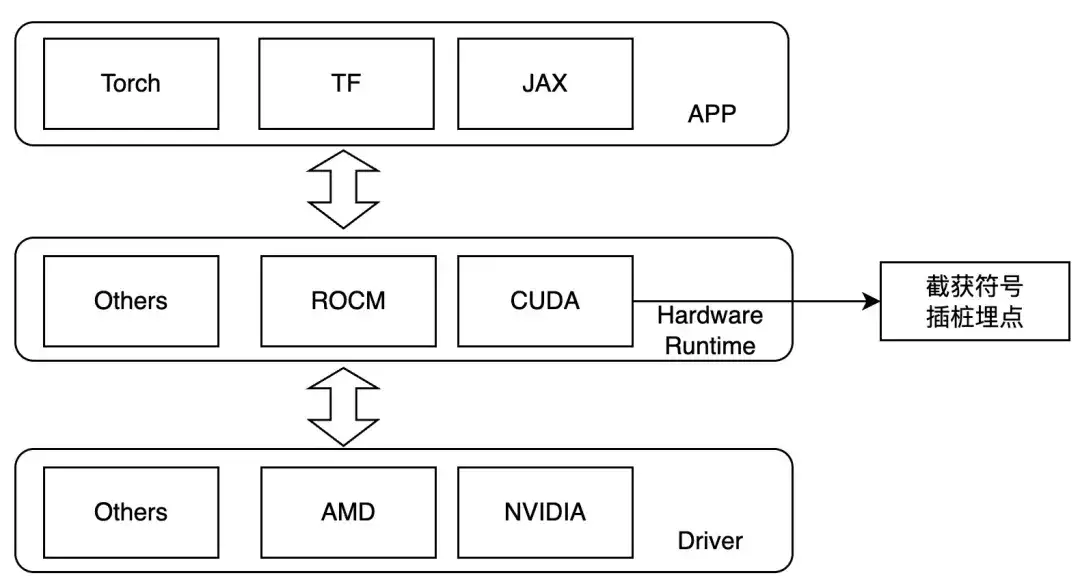
Therefore, we design to intercept at the kernel launch layer, and set LD_PRELOAD during runtime to trace the operations of interest. This method can only be used in the case of dynamic linking. Currently, the mainstream training frameworks are dynamic linking. For NVIDIA GPUs, we can pay attention to the following symbols:
- ibcudart.so
- cudaLaunchKernel
- cudaLaunchKernelExC
- libcublas.so
- cublasGemmEx
- cublasGemmStridedBatchedEx
- cublasLtMatmul
- cublasSgemm
- cublasSgemmStridedBatched
When adapting to different hardware, different tracing functions are implemented through different template classes.
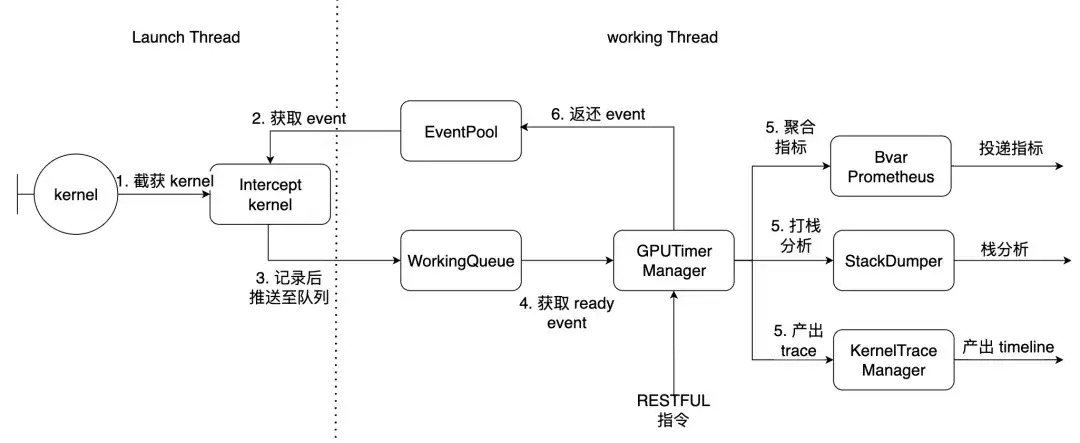
Workflow
Taking PyTorch as an example, the Launch Thread is the main thread of the torch, and the working thread is the working thread inside the library. The 7 kernels described above are intercepted here.
How to use & effects
Preconditions
- NCCL is statically compiled to libtorch_cuda.so
- torch dynamically links libcudart.so
If NCCL is dynamically linked, custom function offsets can be provided and dynamically resolved at runtime. After installing the Python package, you will have the following command line tools
| xpu_timer_gen_syms | Library dynamically injected function offset for dynamically generating and parsing nccl |
| xpu_timer_gen_trace_timeline | Used to generate chrome trace |
| xpu_timer_launch | Used to mount hook packages |
| xpu_timer_stacktrace_viewer | Used to generate a visual stack after timeout |
| xpu_timer_print_env | Print libevent.so address and print compilation information |
| xpu_timer_dump_timeline | Used to trigger timeline dump |
LD_PRELOAD 用法:XPU_TIMER_XXX=xxx LD_PRELOAD=`path to libevent_hook.so` python xxx
Real-time dynamic capture timeline
Each rank has a port service, which needs to send commands to all ranks at the same time. The startup port is brpc. The service port has a data size of 32B for each rank trace. It saves 1000 records and has a size of 32K. The size of the generated timeline json is 150K * world size. , far smaller than the basic usage of torch’s timeline
usage: xpu_timer_dump_timeline [-h]
--host HOST 要 dump 的 host
--rank RANK 对应 host 的 rank
[--port PORT] dump 的端口,默认 18888,如果一个 node 用了所有的卡,这个不需要修改
[--dump-path DUMP_PATH] 需要 dump 的地址,写绝对路径,长度不要超过 1000
[--dump-count DUMP_COUNT] 需要 dump 的 trace 个数
[--delay DELAY] 启动这个命令后多少秒再开始 dump
[--dry-run] 打印参数
Single machine situation
xpu_timer_dump_timeline \
  --host 127.0.0.1 \
  --rank "" \
  --delay 3 \
  --dump-path /root/lizhi-test \
  --dump-count 4000

多机情况# 如下图所示,如果你的作业有 master/worker 混合情况(master 也是参与训练的)
# 可以写 --host xxx-master --rank 0
# 如果还不确定,使用 --dry-run

xpu_timer_dump_timeline \
  --host worker \
  --rank 0-3 \
  --delay 3 --dump-path /nas/xxx --dump-count 4000

xpu_timer_dump_timeline \
  --host worker --rank 1-3 \
  --host master --rank 0 --dry-run

dumping to /root/timeline, with count 1000
dump host ['worker-1:18888', 'worker-2:18888', 'worker-3:18888', 'master-0:18888']
other data {'dump_path': '/root/timeline', 'dump_time': 1715304873, 'dump_count': 1000, 'reset': False}
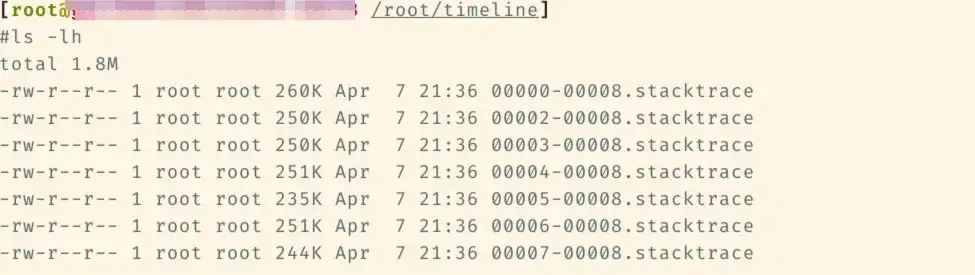
The following files will be added to the corresponding timeline folder later.

Then run xpu_timer_gen_trace_timeline under this file
xpu_timer_gen_trace_timeline 3 files will be generated:
- merged_tracing_kernel_stack auxiliary file, flame graph original file
- trace.json merged timeline
- tracing_kernel_stack.svg, callstack for matrix multiplication/nccl
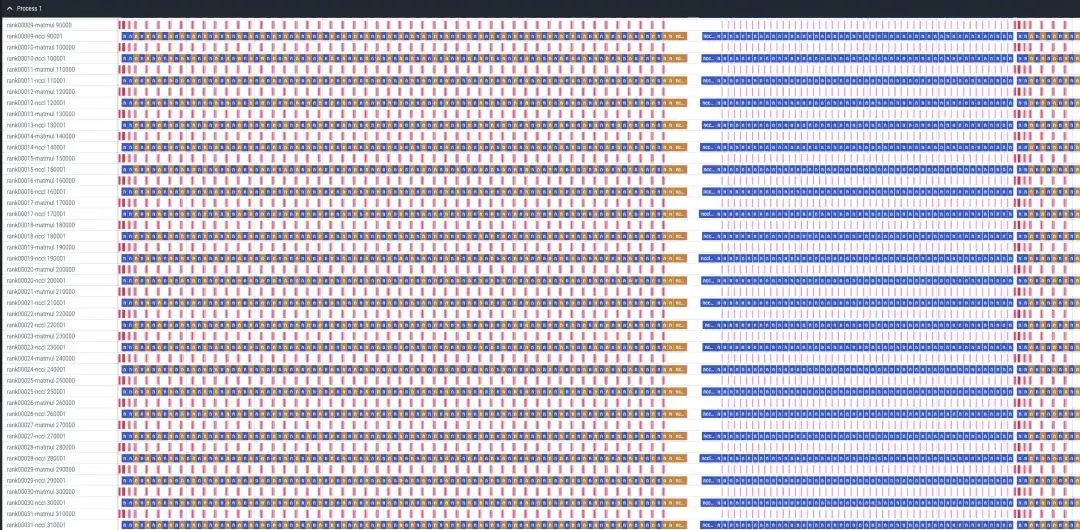
A case of llama-recipes 32 card sft analysis
The timeline is roughly as follows. Each rank will display two lines of matmul/nccl, and all ranks will be displayed. Note that there is no forward/reverse information here. It can be roughly judged by the duration. Reverse is twice as long as forward.
Forward timeline, about 87ms
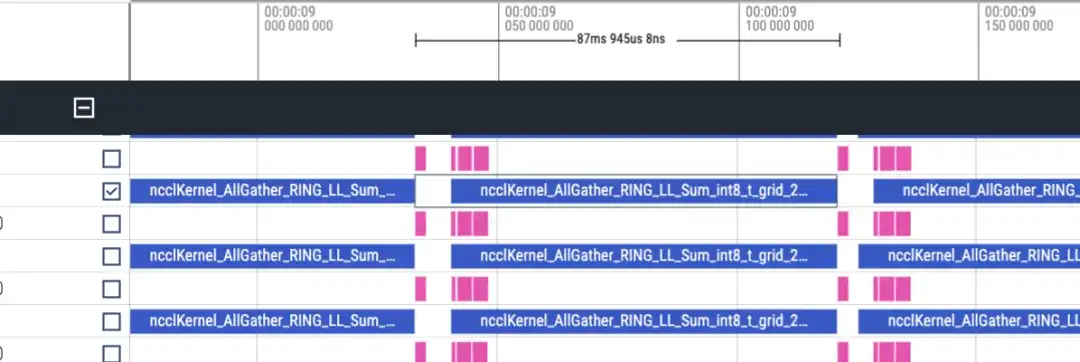
Reverse timeline approximately 173ms
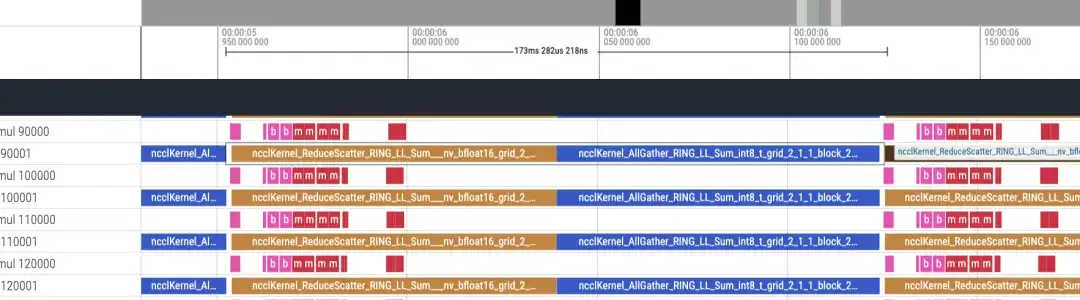
There are 48 layers in total, and the total time consumption is (173+87)*48 = 12480ms. Including lmhead, embedding and other operations, it takes about 13s. The overall time is correct. And through the timeline, it is found that the communication time is much longer than the calculation time, and it can be determined that the bottleneck is caused by communication.
hang stack analysis
After installing the package with pip, you can analyze it through the command line tool. By default, the kernel will print specific stack information after more than 300 seconds. Drag the svg image into chrome to view it. Use pstack/py-spy to print the corresponding stack. , print the results in stderr of the training process. If you install gdb through conda, you will use gdb's python api to obtain the stack. You can obtain the lwp name. The default installed gdb8.2 sometimes cannot be obtained. The default address of conda gdb is /opt/conda/bin/gdb. The following is A 2-card stack to simulate NCCL timeout:
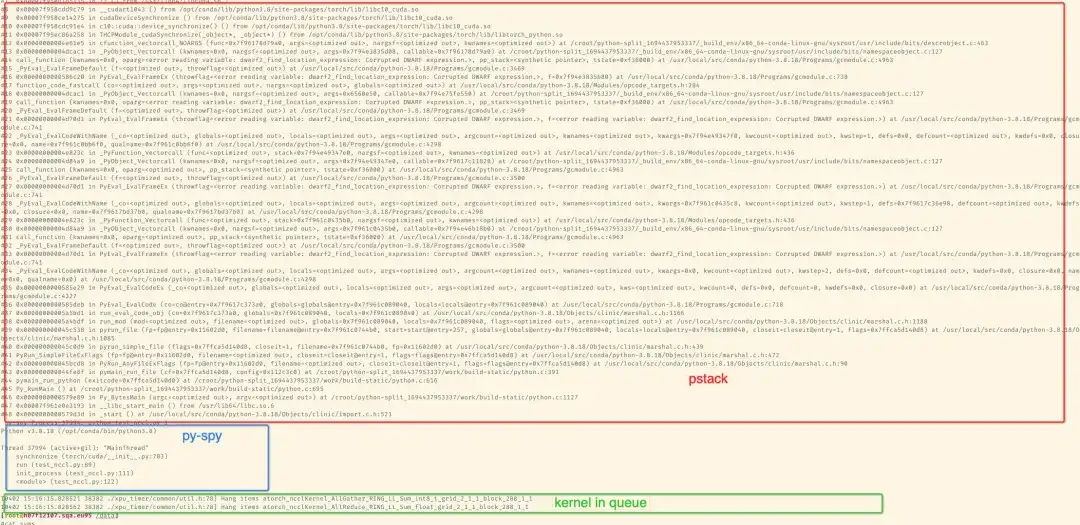
The following is an example of 8-card llama7B sft training on a single machine
Through the tools provided by the python package, the flame stack graph of the aggregation stack can be generated. Here you can see the stack without rank 1 because hang is simulated by killing -STOP rank1 during 8-card training, so rank1 is in the stop state.
xpu_timer_stacktrace_viewer --path /path/to/stack
运行后会在 path 中生成两个 svg,分别为 cpp_stack.svg, py_stack.svg
When merging stacks, we believe that the same callpath can be merged, that is, the stacktrace is completely consistent, so most of the places stuck in the main thread will be the same, but if there are some loops and active threads, the printed stack top may be inconsistent, but The same stack will run at the bottom. For example, the threads in the python stack will be stuck on [email protected]. In addition, the number of samples in the flame graph has no meaning. When a hang is detected, all ranks generate corresponding stacktrace files (rank1 is suspended, so there is none), and each file contains the complete stack of python/c++.
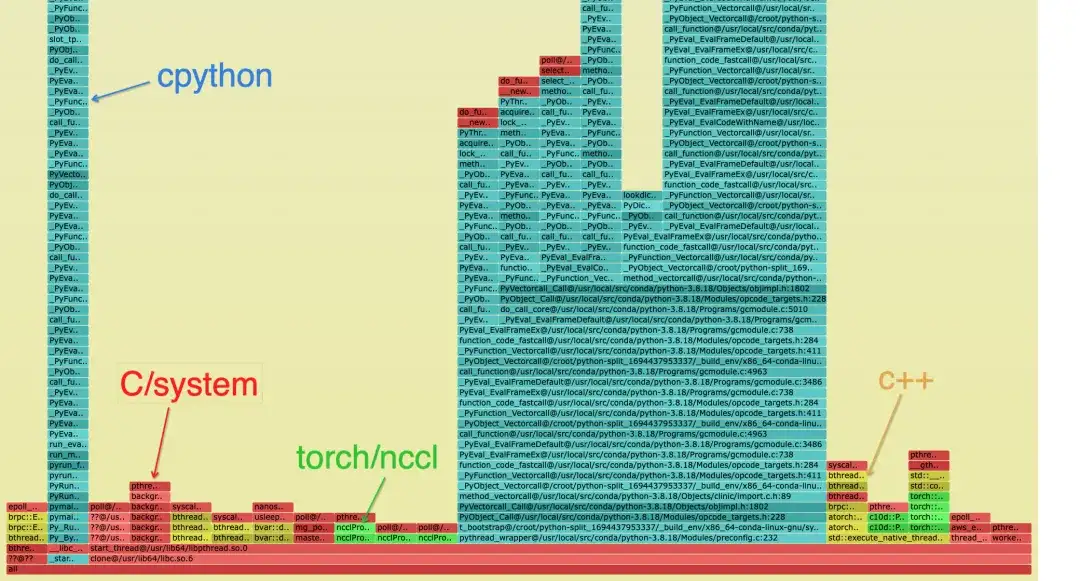
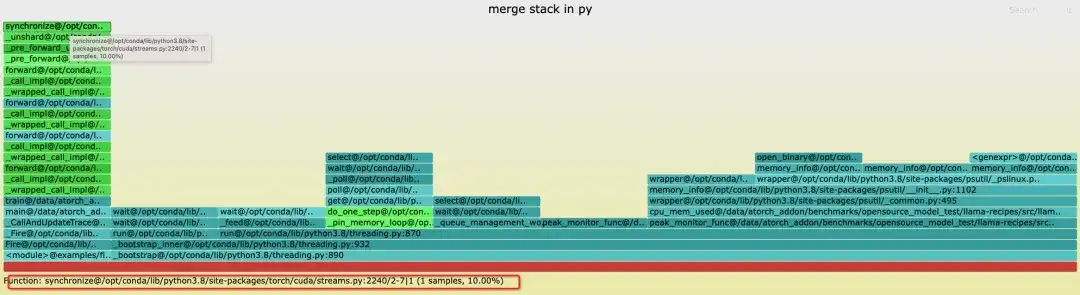
The merged stack is as follows. Different colors are used to distinguish the categories of the stack. On the python stack, there may only be cyan and green:
- Cyan is CPython/Python
- Red is C/other system related
- Green is Torch/NCCL
- Yellow is C++
The Python stack is as follows, the blue block diagram is the specific stack, and the naming rule is: func@source_path@stuck_rank|leak_rank
- func is the current function name. If gdb cannot obtain it, it will be displayed??
- source_path, the so/source address of this symbol in the process
- stuck_rank represents which rank stacks enter here. The consecutive rank numbers will be folded into start-end, such as rank 0,1,2,3 -> 0-3
- leak_rank represents which stacks have not entered here, and the rank number here will also be folded
So the meaning in the picture is that rank0, rank2-7 are all stuck under synchronize, and rank 1 does not come in, so it can be analyzed that there is a problem with rank1 (actually suspended). This information will only be added at the top of the stack
Correspondingly, you can see the stack of cpp and you can see that the main thread is stuck in synchronize, and finally stuck on the acquisition time in cuda.so. It is also only rank1. Without this stack, it can be considered that the stack where __libc_start_main is located represents the entry point of the process.
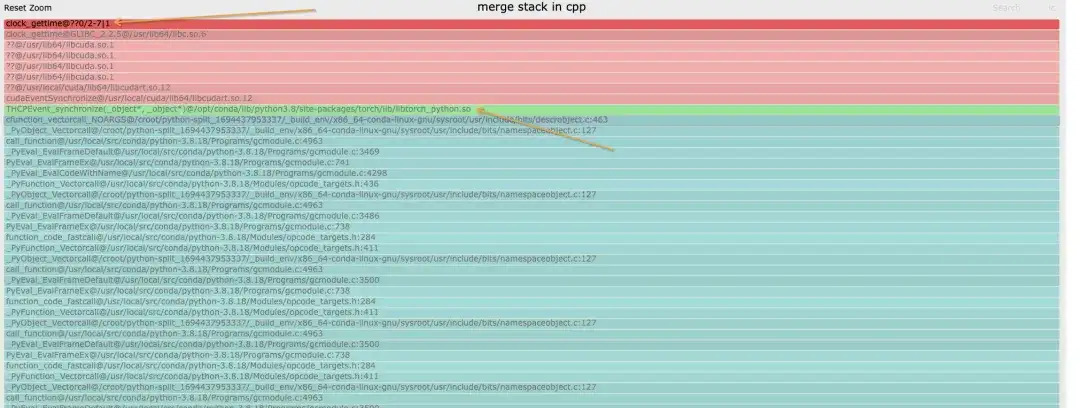
Generally, it can be considered that there is only one deepest link in the stack. If a bifurcation occurs, it proves that different ranks are stuck on different links.
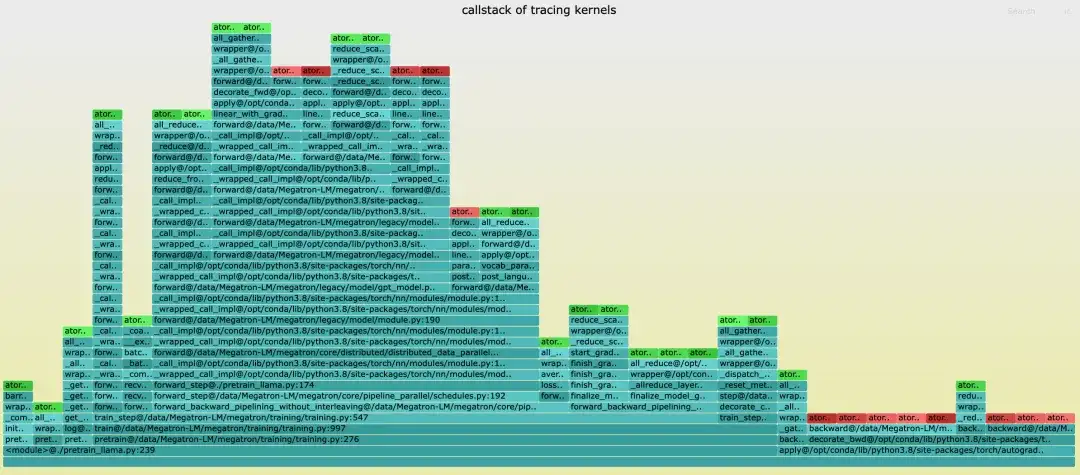
Kernel call stack analysis
Unlike the torch timeline, the timeline does not have a callstack. When generating the timeline, the corresponding stack file name is tracing_kernel_stack.svg. Drag this file into chrome to observe.
- Green is NCCL operation
- The red one is the matmul operation
- The cyan one is the Python stack
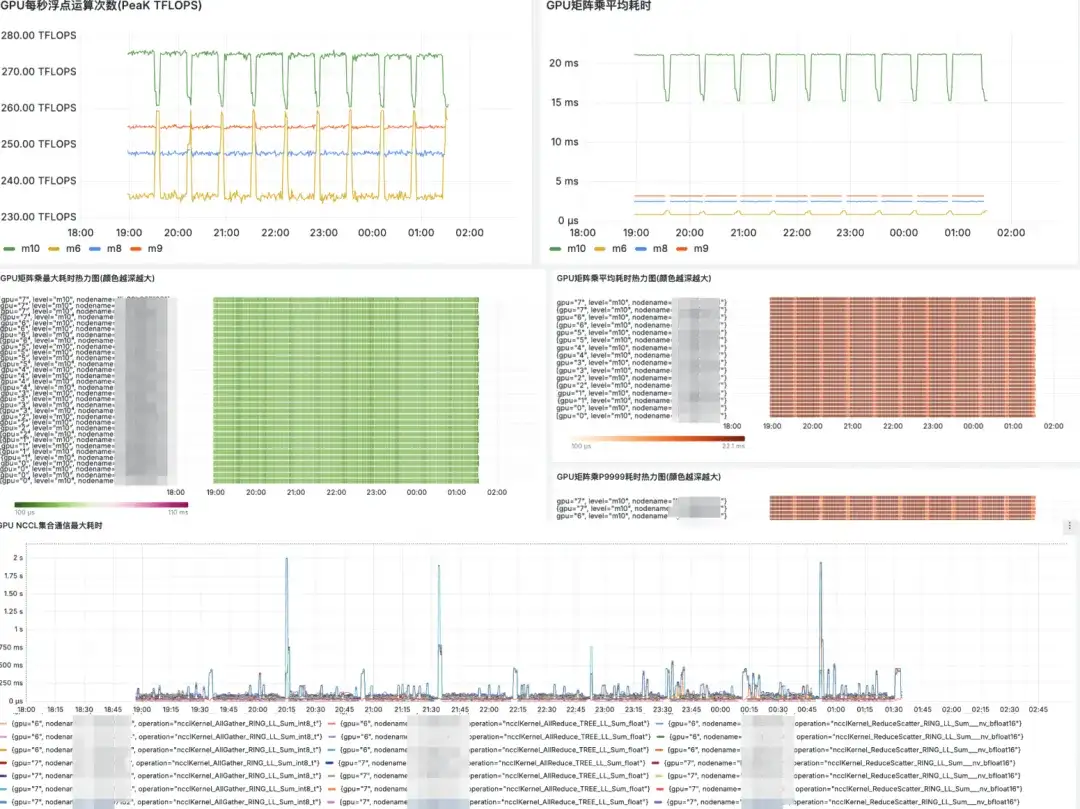
Grafana market display
Future plan
- Add more fine-grained tracing such as NCCL/eBPF to more accurately analyze and diagnose the root cause of hang problems during training;
- Will support more hardware platforms including various domestic graphics cards.
About DLRover
DLRover (Distributed Deep Learning System) is an open source community maintained by the Ant Group AI Infra team. It is an intelligent distributed deep learning system based on cloud native technology. DLRover allows developers to focus on the design of the model architecture without having to deal with any engineering details, such as hardware acceleration and distributed operation. It also develops algorithms related to deep learning training to make training more efficient and intelligent, such as optimizers. Currently, DLRover supports the use of K8s and Ray for automated operations and maintenance of deep learning training tasks. For more AI Infra technology, please pay attention to the DLRover project.
Join DLRover DingTalk technology exchange group: 31525020959
DLRover Star:
https://github.com/intelligent-machine-learning/dlrover
Article recommendations