
This article is based on the speech "Financial Technology Go Microservices" given by Liu Yi, senior R&D engineer of Founder Securities Financial Technology Engineering Institute, at the "Cloud Native✖️Microservice Architecture and Technical Practice in the AI Era" CloudWeGo Technology Salon Beijing event held in Beijing on March 30, 2024. Compiled from "Construction Practice".
Overview: This article will introduce in detail the practical experience of Founder Securities Financial Technology Engineering Institute in the construction of cloud native microservices. The sharing includes three aspects:
- Microservice governance work
- Microservices observability work
- The above capabilities of microservice interface management are unified and integrated into Founder’s Quark development platform.
Introduction to the practice of microservice construction of Founder Securities
At the beginning of 2023, we launched the construction of a microservice system, in which the registration center uses ZooKeeper , and the Web and RPC application frameworks use CloudWeGo's Hertz and Kitex respectively .
At present, we have entered the deep-water area of microservice construction, which mainly involves microservice governance , observability capabilities , interface management and other related work. The following will introduce in detail the concepts and implementation principles.
Microservice governance capability building
concept
Under the microservice architecture, as the business volume gradually increases, the number of services will also gradually increase. Based on this background, as the business develops, it will become increasingly difficult to manage and control services. The role of service governance is to solve a series of problems caused by service splitting so that services can run more stably. The topics involved include It provides service registration and discovery, load balancing, service circuit breaker, service degradation, service current limiting, etc. The timeout, retry and server-side current limiting functions provided by the Quark platform are all based on the related capabilities of Kitex . The registration center currently used is ZooKeeper (abbreviated as zk), so the related dynamic configuration is also implemented with the help of zk, through Write the configuration to zk to notify the server and client to complete the activation of related functions.
introduce
-
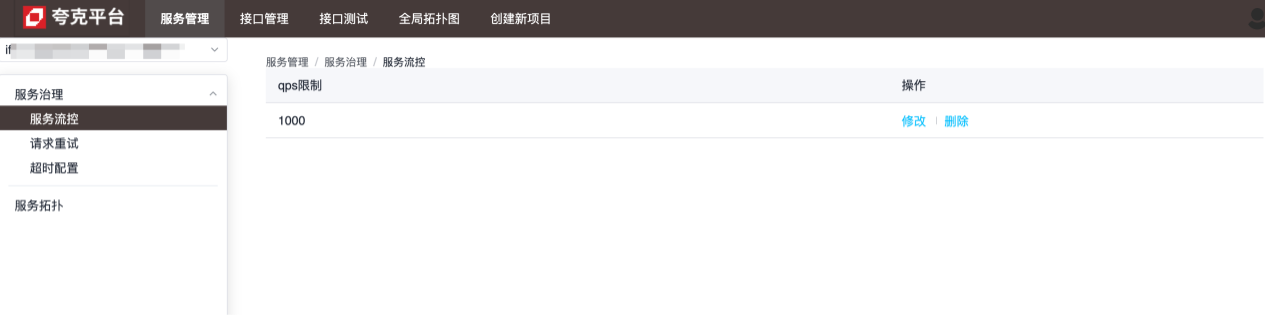
flow control
The granularity of flow control is service level. As shown in the figure below, the service can handle up to 1,000 requests per second, and excessive requests will be shut down directly:
-
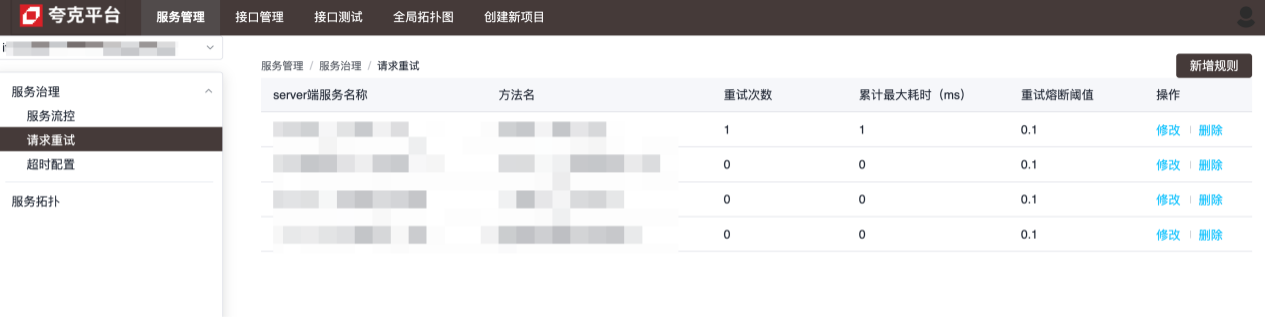
Retry configuration
The granularity of retry configuration is method level, which is used to configure how to retry when the current service fails to make a request to a method of the specified service:
-
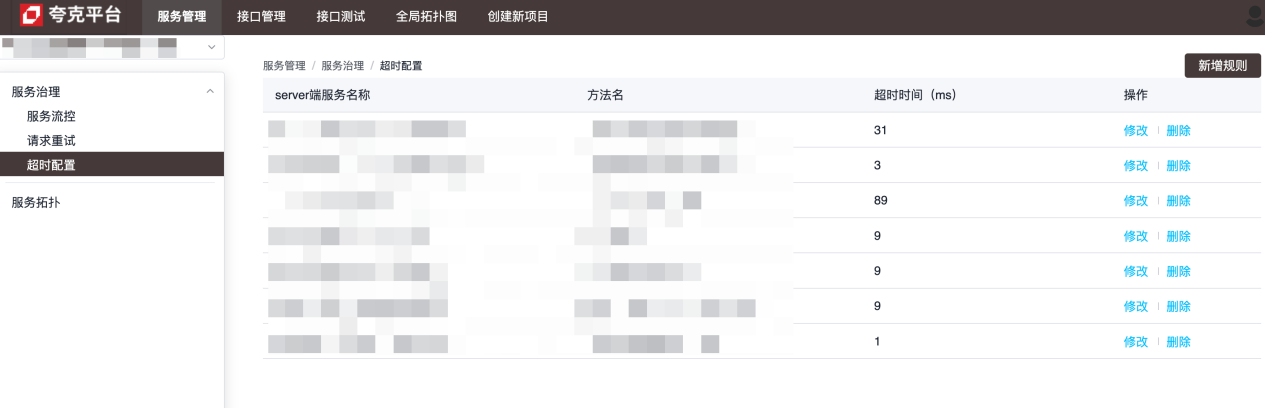
Timeout configuration
The granularity of the timeout configuration is at the method level, which is used to configure the maximum time it takes for the current service to request a method of the specified service. When this value is exceeded, the current service will disconnect: see the configuration description for the specific functions of each configuration.
Implementation principles and details
Both the server side and the client side complete the dynamic injection of relevant configurations by extending Kitex 's suite.
server side
Configure Kitex server through the following code:
server.WithSuite(zooKeeperServer.NewSuite("Kitex-server", zooKeeperClient))
Among them, zooKeeperServer.NewSuite("Kitex-server", zooKeeperClient)a suite instance will be returned, and the limiter configuration injected into the server will be included: Options
func (s *zooKeeperServerSuite) Options() []server.Option {
    opts := make([]server.Option, 0, 2)
    // WithLimiter实现中,在zk中注册了监听器,每当数据变化,动态更新Limiter的相关配置,以达到限流目的
    opts = append(opts, WithLimiter(s.service, s.zooKeeperClient, s.opts))
    return opts
}
Based on the above content, it can be found that only limiters are configured by default in the server-side suite. The Kitex framework currently only supports two types of limiters:
- Connections limiter (limit the maximum number of connections)
- Qps limiter (limit maximum qps)
When using zk as the registration center, both can be dynamically adjusted through configuration. After changes, the configuration values are obtained through zk's listener:
// zk数据变化时的回调方法
onChangeCallback := func(restoreDefault bool, data string, parser zooKeeper.ConfigParser) {
   lc := &limiter.LimiterConfig{}
   if !restoreDefault && data != "" {
      err := parser.Decode(data, lc)
      if err != nil {
         klog.Warnf("[zooKeeper] %s server zooKeeper config: unmarshal data %s failed: %s, skip...", dest, data, err)
         return
      }
   }
   // 将zk中的数据动态更新到配置中
   opt.MaxConnections = int(lc.ConnectionLimit)
   opt.MaxQPS = int(lc.QPSLimit)
   u := updater.Load()
   if u == nil {
      klog.Warnf("[zooKeeper] %s server zooKeeper limiter config failed as the updater is empty", dest)
      return
   }
   if !u.(limit.Updater).UpdateLimit(opt) {
      klog.Warnf("[zooKeeper] %s server zooKeeper limiter config: data %s may do not take affect", dest, data)
   }
}
// path,对于limiter,其值为:/KitexConfig/{ServiceName}/limit
zooKeeperClient.RegisterConfigCallback(context.Background(), path, uniqueID, onChangeCallback)
client side
Similar to the server side, the client side also has the same configuration:
bizService.NewClient("Kitex-client",
client.WithSuite(zooKeeperclient.NewSuite("Kitex-server", "Kitex-client", zooKeeperClient)))
The suite on the client side contains the following options:
func (s *zooKeeperClientSuite) Options() []client.Option {
    opts := make([]client.Option, 0, 7)
    opts = append(opts, WithRetryPolicy(s.service, s.client, s.zooKeeperClient, s.opts)...)
    opts = append(opts, WithRPCTimeout(s.service, s.client, s.zooKeeperClient, s.opts)...)
    opts = append(opts, WithCircuitBreaker(s.service, s.client, s.zooKeeperClient, s.opts)...)
    return opts
}
That is, the client supports three dynamic configurations: retry, timeout, and circuit breaker. Relevant processing is done through the callback method of the zk client to achieve the effect of dynamic update.
Additional notes on timeout configuration
For timeout, the specific implementation of its configuration method is as follows:
func WithRPCTimeout(dest, src string, zooKeeperClient zooKeeper.Client, opts utils.Options) []client.Option {
    // ...
    return []client.Option{
        client.WithTimeoutProvider(initRPCTimeoutContainer(path, uid, dest, zooKeeperClient)),
        client.WithCloseCallbacks(func() error {
            // cancel the configuration listener when client is closed.
            zooKeeperClient.DeregisterConfig(path, uid)
            return nil
        }),
    }
}
client.WithTimeoutProviderFinally, the specific configuration related to timeout is completed by calling the method provided by Kitex . For timeouts, there are the following different configuration methods:
func WithRPCTimeout(d time.Duration) Option {
    // ...
}

func WithConnectTimeout(d time.Duration) Option {
    // ...
}

func WithTimeoutProvider(p rpcinfo.TimeoutProvider) Option {
    // ...
}
Among them, WithTimeoutProviderthe set timeout will be overwritten WithRPCTimeoutby the set value of , so if or WithConnectTimeoutis called when creating Kitex client, the dynamic configuration will not take effect.WithRPCTimeoutWithConnectTimeout
Configuration instructions
time out
Corresponding zk node:/kitexConfig/{ClientName}/{ServiceName}/rpc_timeout
The written configuration format is as follows:
{
  "*": {
    "conn_timeout_ms": 100,
    "rpc_timeout_ms": 800
  },
  "GetDemoInfo": {
    "rpc_timeout_ms": 300
  },
  "GetDemoInfo3": {
    "rpc_timeout_ms": 300
  }
}
Field meaning : the maximum waiting time to establish a new connection; : the maximum time for an rpc call; conn_timeout_ms rpc_timeout_ms
Retry
Corresponding zk node:/kitexConfig/{ClientName}/{ServiceName}/retry
The written configuration format is as follows:
{
  "GetDemoInfo": {
    "enable": true,
    "type": 0,
    "failure_policy": {
      "stop_policy": {
        "max_retry_times": 2,
        "max_duration_ms": 9000,
        "cb_policy": {
          "error_rate": 0.1
        }
      }
    }
  },
  "GetDemoInfo5": {
    "enable": true,
    "type": 0,
    "failure_policy": {
      "stop_policy": {
        "max_retry_times": 2,
        "max_duration_ms": 9000,
        "cb_policy": {
          "error_rate": 0.1
        }
      }
    }
  }
}
Field meaning
| Configuration items | default value | illustrate | limit |
|---|---|---|---|
| max_retry_times | 2 | The maximum number of retries, excluding the first request. If configured to 0, it means to stop retrying. | Legal values: [0-5] |
| max_duration_ms | 0 | The cumulative maximum time elapsed, including the time elapsed for the first failed request and the retry request. If the elapsed time reaches the limit, subsequent retries will be stopped. 0 means no limit. Note: If configured, this configuration item must be greater than the request timeout. | |
| error_rate | 10% | Retry circuit breaker error rate threshold, if the method level request error rate exceeds the threshold, retries will be stopped. | Legal values: (0-30%] |
Limiting
This configuration is a global configuration for the service, so the zk node path only contains serviceName:/kitexConfig/{ServiceName}/limit
The written configuration format is as follows:
{
  "qps_limit": 100
}
Microservice observability capability building
concept
Service observability construction refers to the establishment and improvement of monitoring, logging, tracking and other tools and technologies in distributed systems in order to comprehensively and timely understand the operating status and performance indicators of the system.
A complete observation tool can bring many benefits to business systems:
- Ability to detect and solve problems in a timely manner;
- Enable the team to have a clearer understanding of the overall operation and internal interactions of the system;
- Can understand the load status, resource utilization and trend changes of the system to support capacity planning and resource optimization;
- By recording the system's operation logs and request traces through the log and tracking system, user operation behaviors, abnormal requests and security events can be tracked and analyzed to improve the security and reliability of the system.
introduce
Service details are used to display the overall operation of the service itself, including golden monitoring indicators (QPS, Latency and Error Ratio), SLO and runtime related information, etc.: 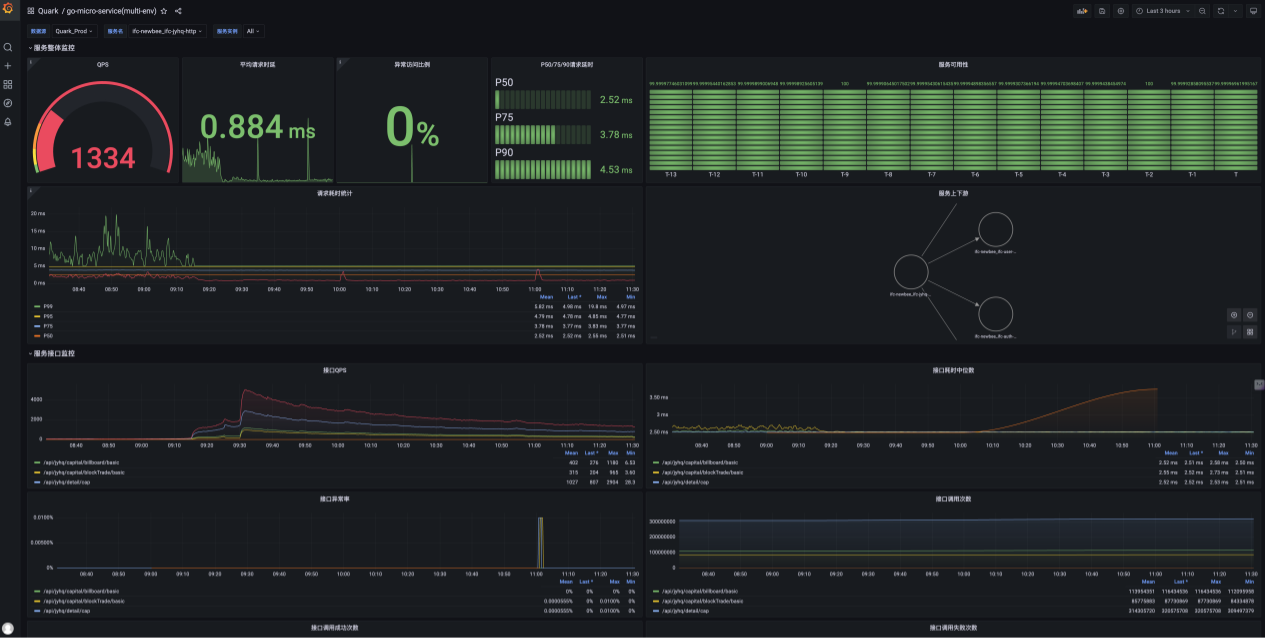
Topology diagram is used to show the upstream and downstream dependencies between services: 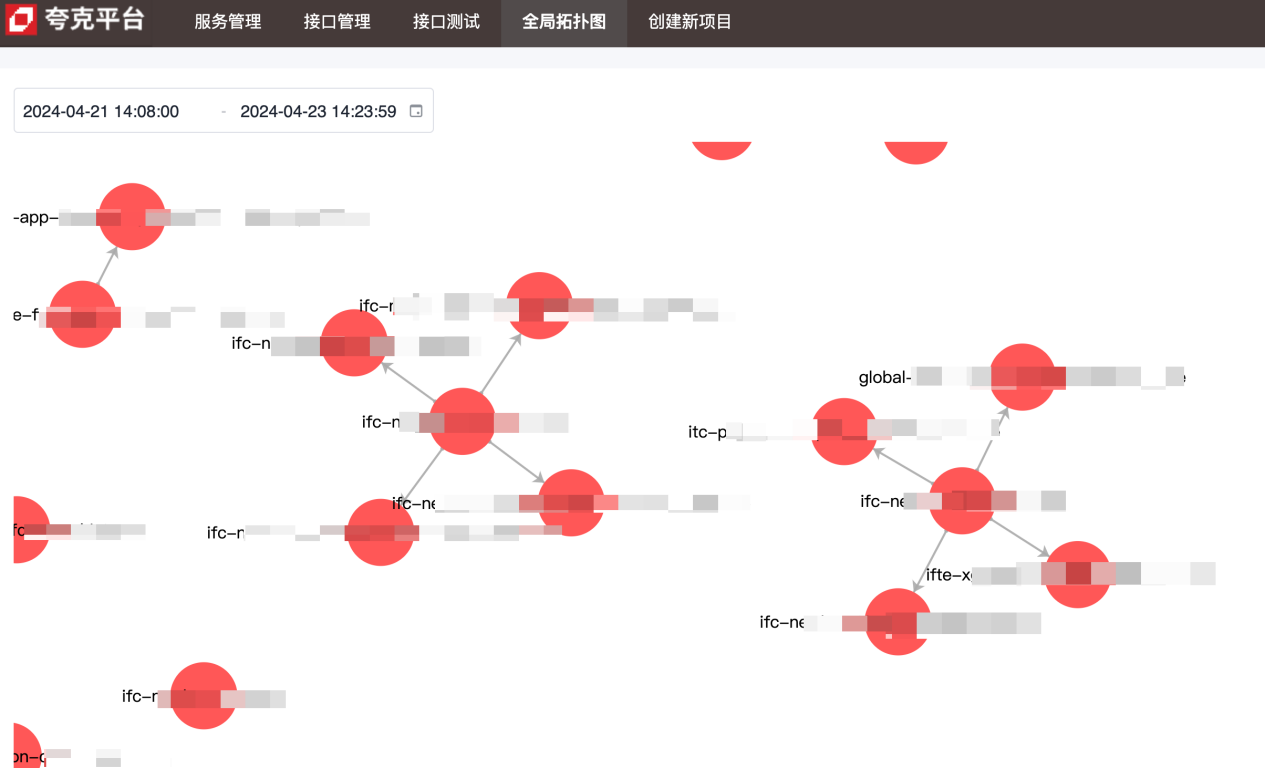
Call chain data contains detailed information about each call between services: 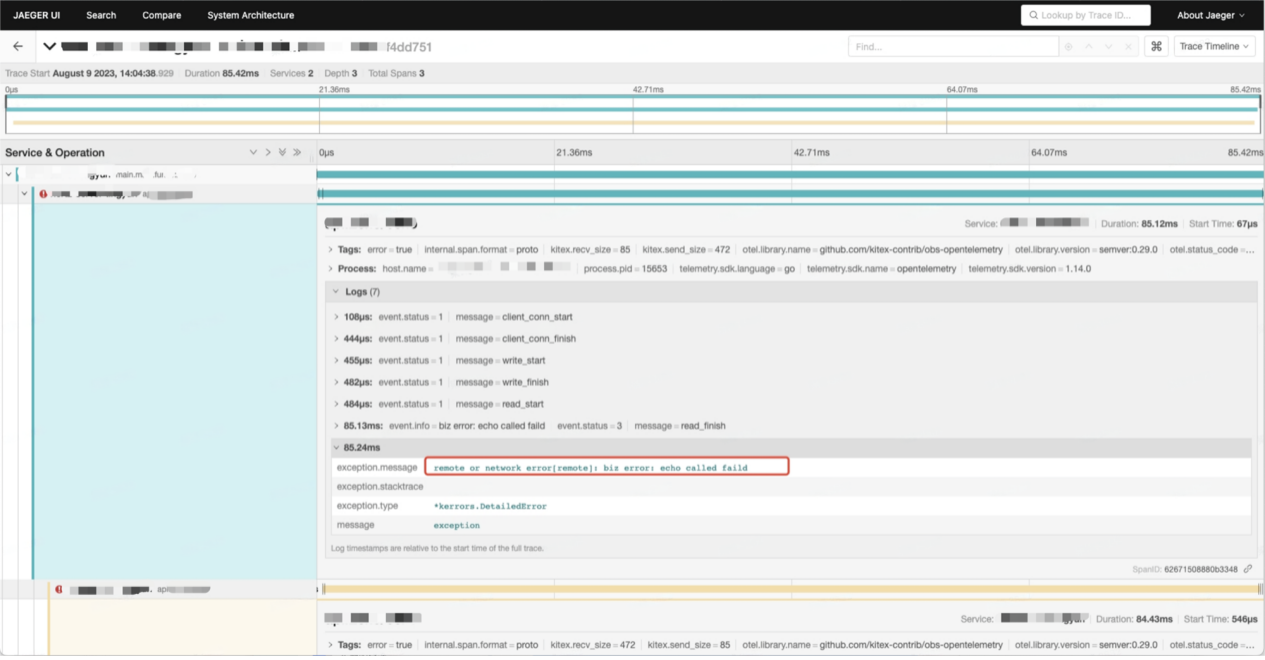
Implementation principles and details
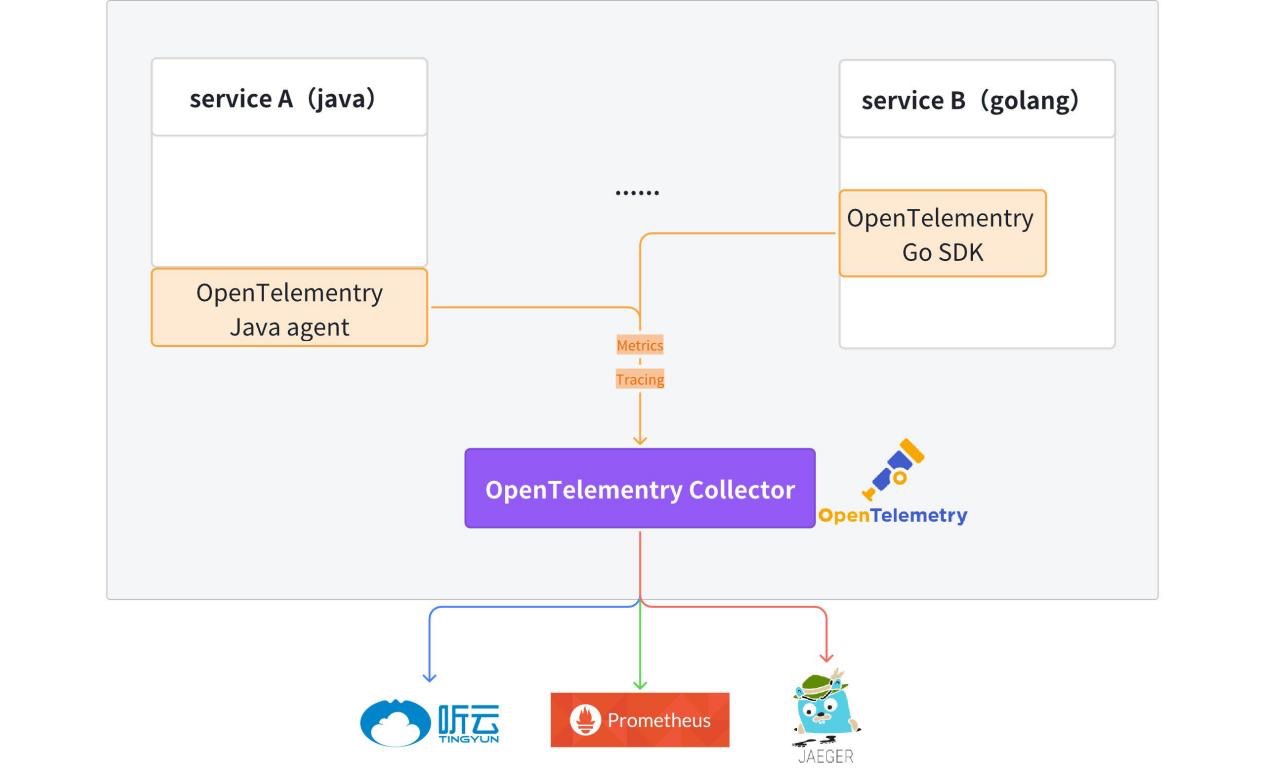
Currently, the OpenTelemetry client has been integrated into the template code , and the generated Hertz and Kitex services have observable data (Metrics + Tracing) reporting capabilities by default.
For detailed information, please refer to: kitex-contrib/obs-opentelemetry and hertz-contrib/obs-opentelemetry
OpenTelemetry (OTel) is an open source observability framework that allows development teams to generate, process, and transmit telemetry data in a unified, single format. It was developed by the Cloud Native Computing Foundation (CNCF) to provide standard protocols and tools for collecting and sending metrics, logs, and traces to monitoring platforms. OpenTelemetry provides vendor-independent SDKs, APIs, and tools. OpenTelemetry is quickly becoming the dominant observability telemetry data standard for cloud-native applications. Adopting OpenTelemetry is critical for organizations that want to be ready to meet future data needs without being locked into a specific vendor or limited by their legacy technology.
Trace
Tracing provides a complete picture of the entire life cycle from request reception to completion.
After receiving the request, the service enables link tracking from meta information (Kitex) or http header (Hertz). If there is no Tracing information in the meta information or HTTP header, new link tracing will be automatically enabled. Link information is passed within the service process through context.
Access method:
// for Hertz
tracer, cfg := hertztracing.NewServerTracer()
h := server.Default(tracer)
h.Use(hertztracing.ServerMiddleware(cfg))
// for Kitex
svr := echo.NewServer(new(DemoImpl),
    server.WithSuite(tracing.NewServerSuite()),
    server.WithServerBasicInfo(&rpcinfo.EndpointBasicInfo{ServiceName: serviceName}),)
Tracing information is reported to OpenTelemetry Collector and then transparently transmitted to Jaeger. Link related information can be queried in Jaeger.
Provides a unified log printer fzlog, which prints tracing related information by default.
{
  "file": "get_repositories.go:33",
  "func": "gitlab.fzzqft.com/ifte-quark/quark-api/biz/service.(*GetRepositoriesService).Run",
  "level": "info",
  "msg": "GetRepositoriesService Run req: page:1 limit:10 service_name:\"kitex\"",
  "span_id": "aa26bab58cdf6806",
  "time": "2024-04-23 15:59:40.609",
  "trace_flags": "01",
  "trace_id": "f714dbe2a96b1882dfc4b81909e55643"
}
After the logs are collected and processed, the relevant log information of the entire link can be queried on the log platform . trace_id
Metrics
Metrics are key data that measure system performance and behavior, such as request rate, response time, error rate, etc. Metrics are typically collected, aggregated, and visualized in order to monitor system health and perform trend analysis.
Currently, each service reports its own Metrics data and stores them uniformly in Prometheus/VictoriaMetrics, and finally uses grafana to form a monitoring panel.
The following uses three common service description indicators: QPS, request time, and error rate to demonstrate how to use the Metrics data reported by the service.
-
QPS: Based on the definition of QPS, we only need to obtain the number of real-time requests to calculate QPS.
http_server_duration_countThe value in the reported data is consistent with the number of requests, so this Metric can be used to complete the calculation of QPS.sum(rate(http_server_duration_count{service_name="$service_name"}[$__rate_interval]))CopyIn the above promQL, the rate function is used to calculate the growth rate of a certain metric within a specified time period, and the final result is the average number of requests within the specified time period.
-
Request time consumption: Since it is a statistical data, here we choose to use the average to represent the time consumption of service requests. The average time consumption is obtained by the total time consumption of all requests in the specified time period ➗The number of requests in the specified time period:
sum(rate(http_server_duration_sum{service_name="$service_name"}[$__rate_interval])) by (application) /
sum(rate(http_server_duration_count{service_name="$service_name"}[$__rate_interval])) by (application)
Copy -
Error rate: First filter out the number of erroneous requests and divide by the total number of requests to get the error rate
round((1 - (sum(rate(http_server_duration_count{service_name="$service_name",http_status_code=~"^(2|3).*"}
[$__interval]))/sum(rate(http_server_duration_count{service_name="$service_name"}[$__interval])))), 0.0001)
Copy
Topology
The overall inter-service dependencies are displayed through the Metric data mentioned in the aggregation. The reported data contains service_nameand information, sourceand the upstream and downstream information of the service can be obtained targetthrough the PromSQL operator.sum
Microservice interface management capability building
concept
-
IDL
Interface Description Language (IDL) is a computer language used to describe the interface of software components. IDL describes interfaces in a programming language-independent way, allowing objects running on different platforms and programs written in different languages to communicate with each other.
-
Interface management
Kitex (RPC) services are all implemented based on IDL. The interface management platform mainly provides an interface platform to manage the IDL products of RPC services, making it easier for developers to manage and call RPC interfaces.
-
Interface testing
The Kitex (RPC) service is unreachable for testing. Users of the interface testing platform solve this problem to facilitate testing and development by initiating RPC requests through the platform to complete debugging.
introduce
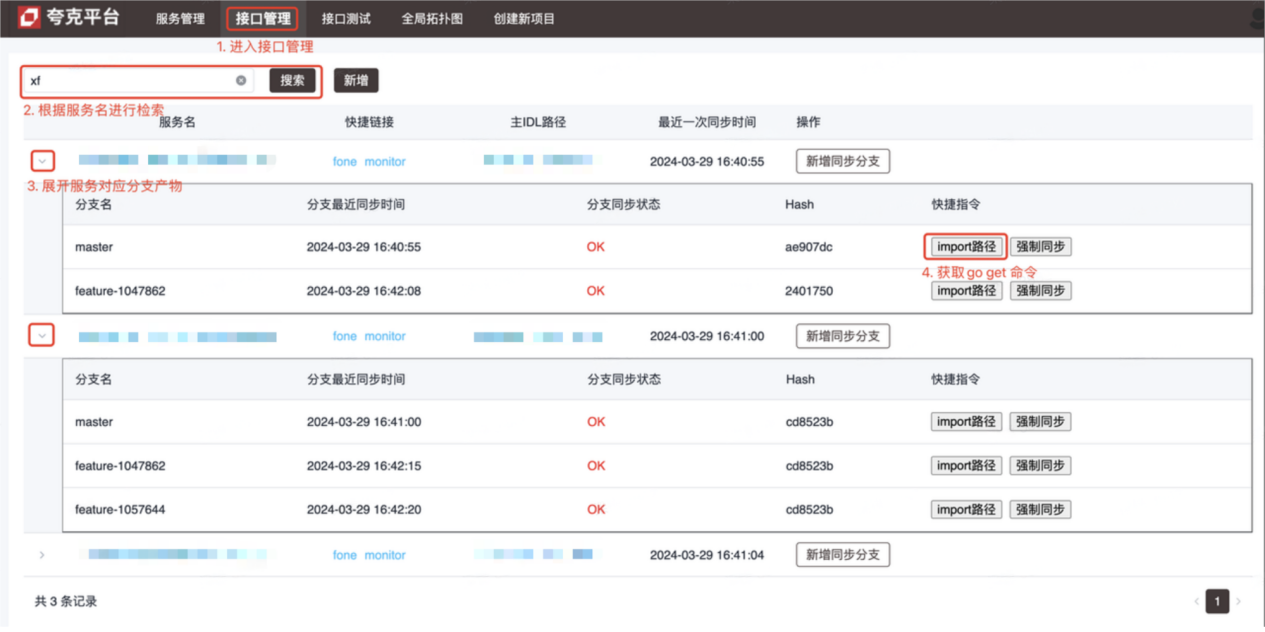
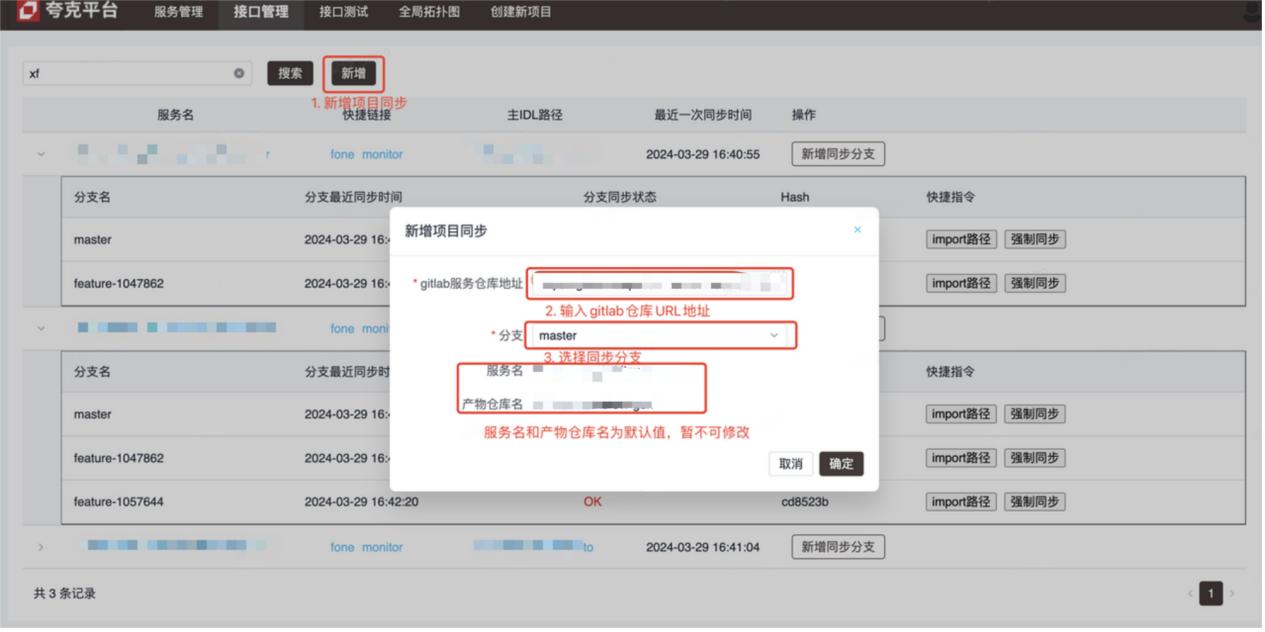
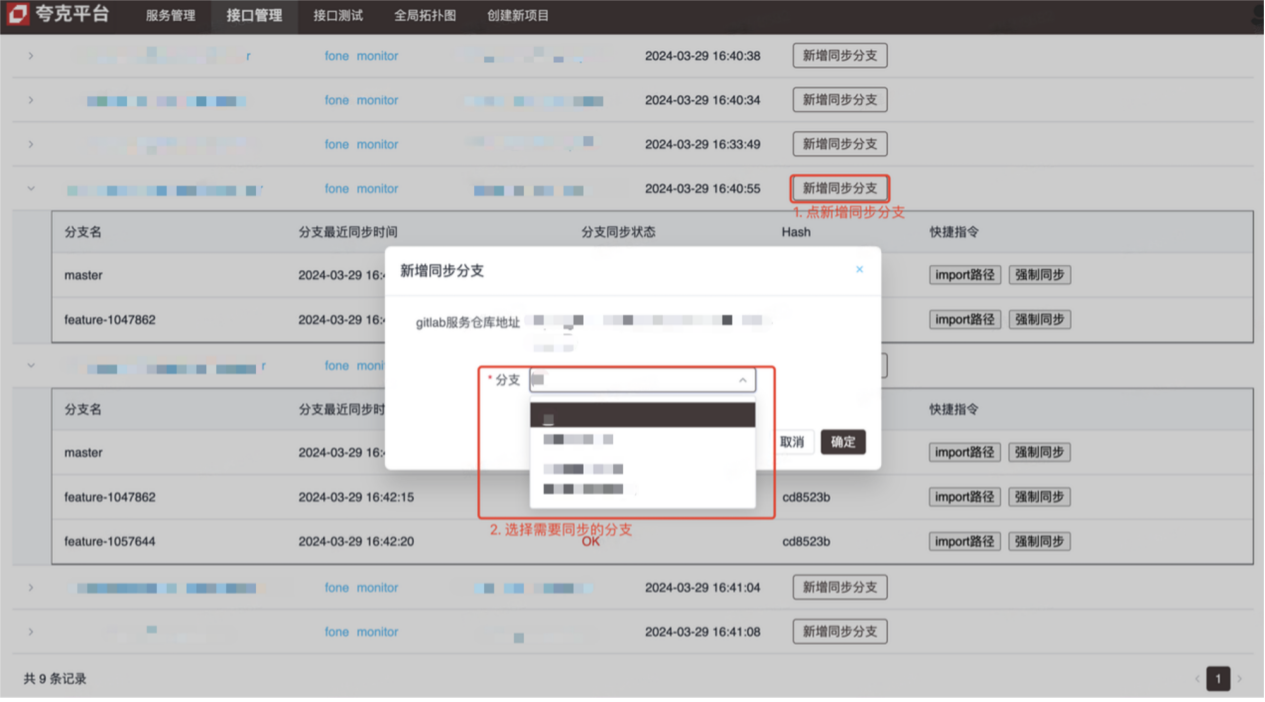
- Interface management platform (see picture for operation method)
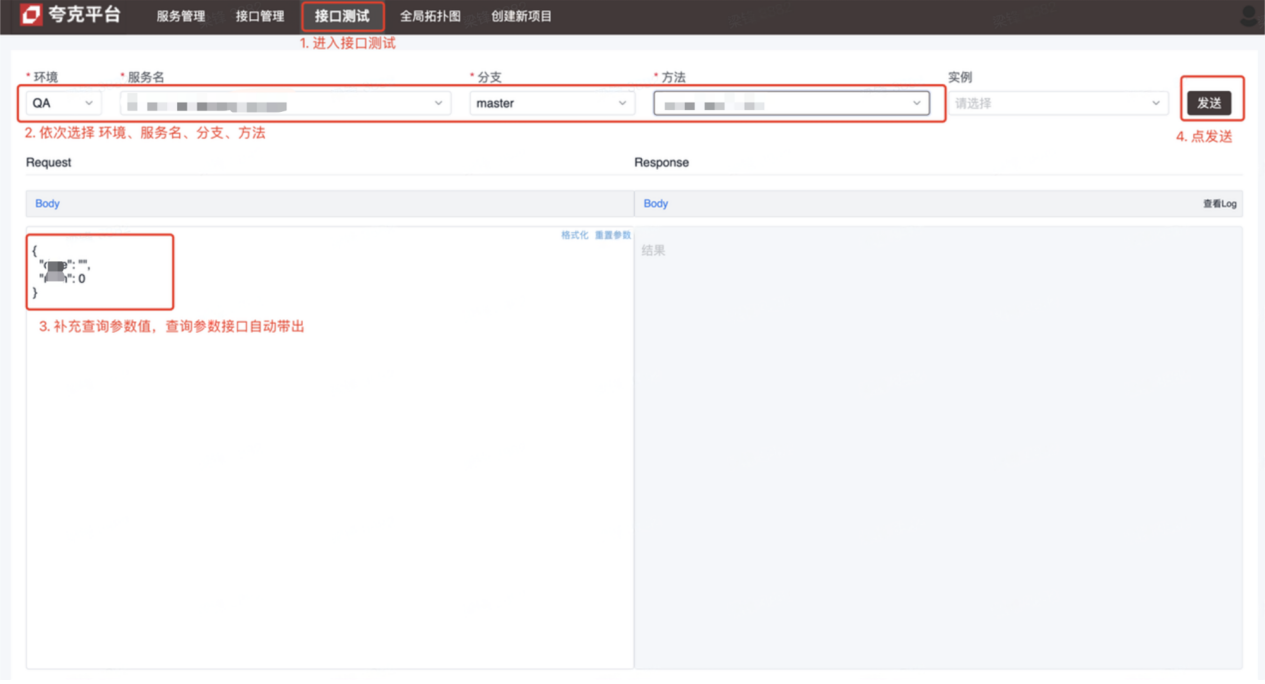
- Interface test platform (debugging Kitex (RPC) interface)
Implementation principles and details
-
Interface management
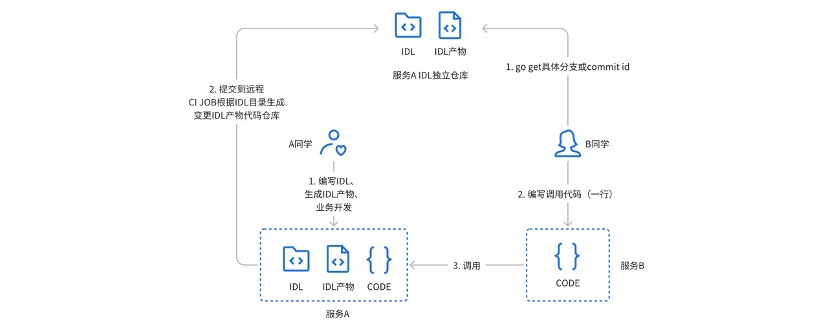
Previously, we used an independent warehouse with gitlabci to manage the IDL products of the Kitex service: during actual use, there were the following pain points:
- The caller needs to obtain the address, branch or version number of the IDL product warehouse through a small window (private chat)
- The service provision method needs to pay attention to both the service project warehouse and the corresponding product warehouse.
- Gitlabci strongly relies on runner, and new groups need to be configured by the administrator before they can be used.
- Unable to deeply bind to existing CICD process
In order to solve the above problems and pain points, an interface management platform was designed and developed.
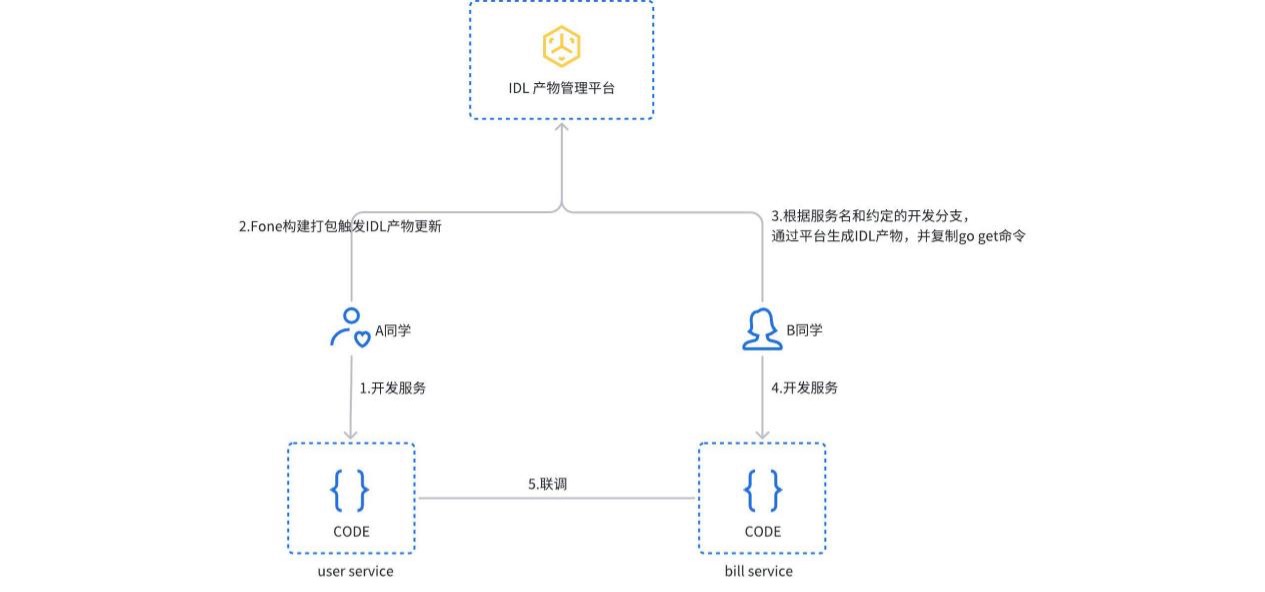
When the service is built and packaged, the IDL product update process is triggered. The platform will automatically detect the service type and generate the corresponding IDL product and submit it to the gitlab independent warehouse. Users can also manually create or update IDL products in the platform. The caller only needs to copy and execute the import path command to obtain the corresponding version of the service dependency.
-
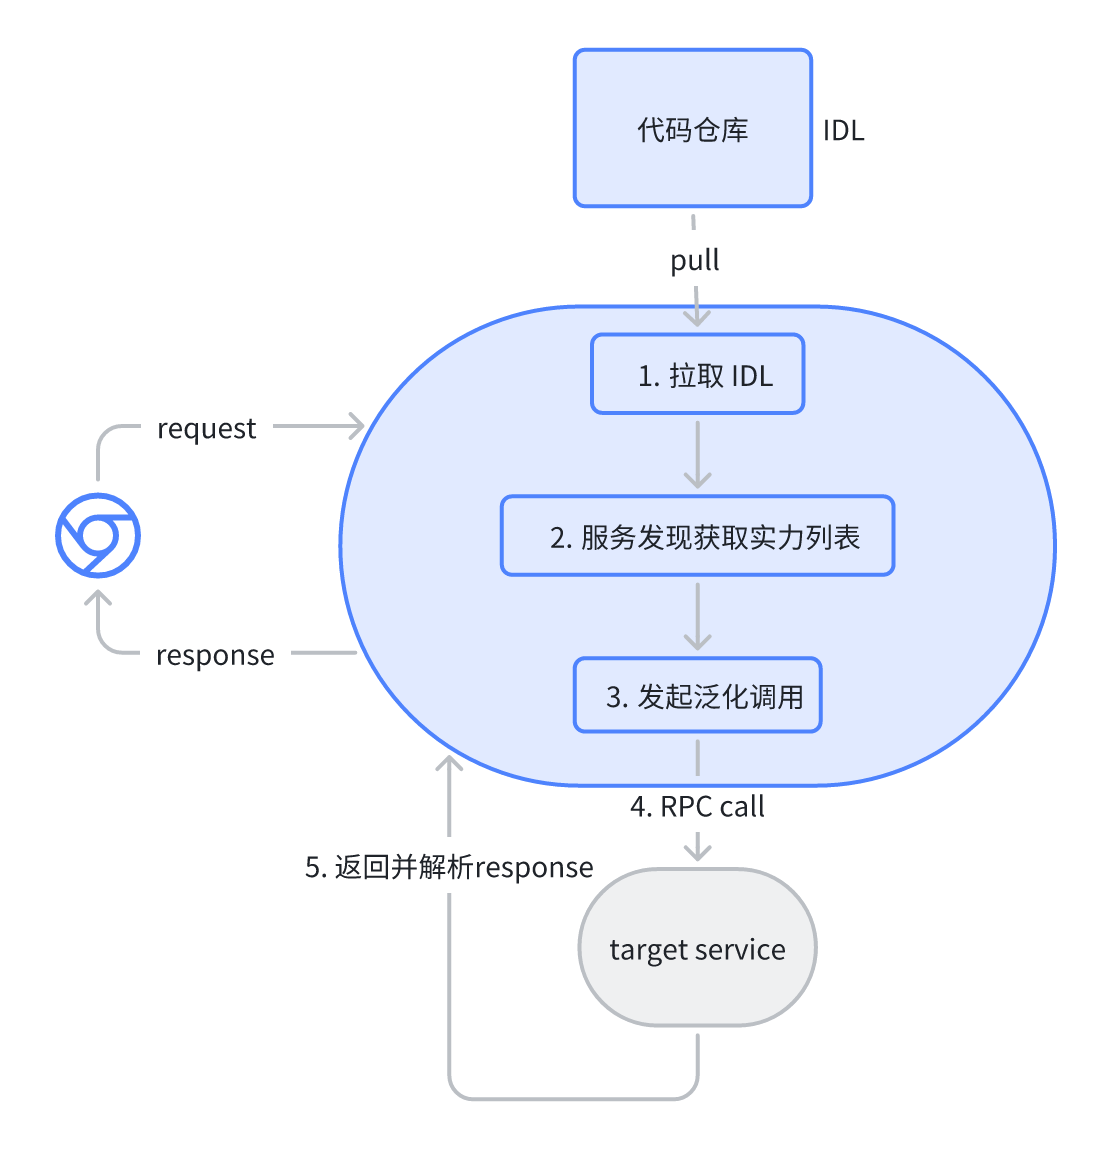
The interface test is implemented based on Kitex PB's JSON mapping generalization call. The user selects the corresponding service and interface on the platform, and the platform automatically parses the corresponding IDL file and gives the default request parameters (json format). After sending the request, the platform initiates an RPC request to the target service through a generalized call and returns the result.
summary
The current microservice system can already meet most technical needs, but we plan to go further under the cloud-native system:
- Service governance relies on cloud-native service mesh (ServiceMesh) capabilities to manage traffic, while also incorporating east-west traffic from other application frameworks.
- Observability, OpenTelemetry is a set of solutions that are independent of language and application framework. Through unified semantics, it plans to incorporate Java's Web (Springboot) and RPC (Dubbo) systems together.
- Interface management, in the future it is planned to unified manage RPC and HTTP interfaces and automatically generate interface use cases.
recent activities
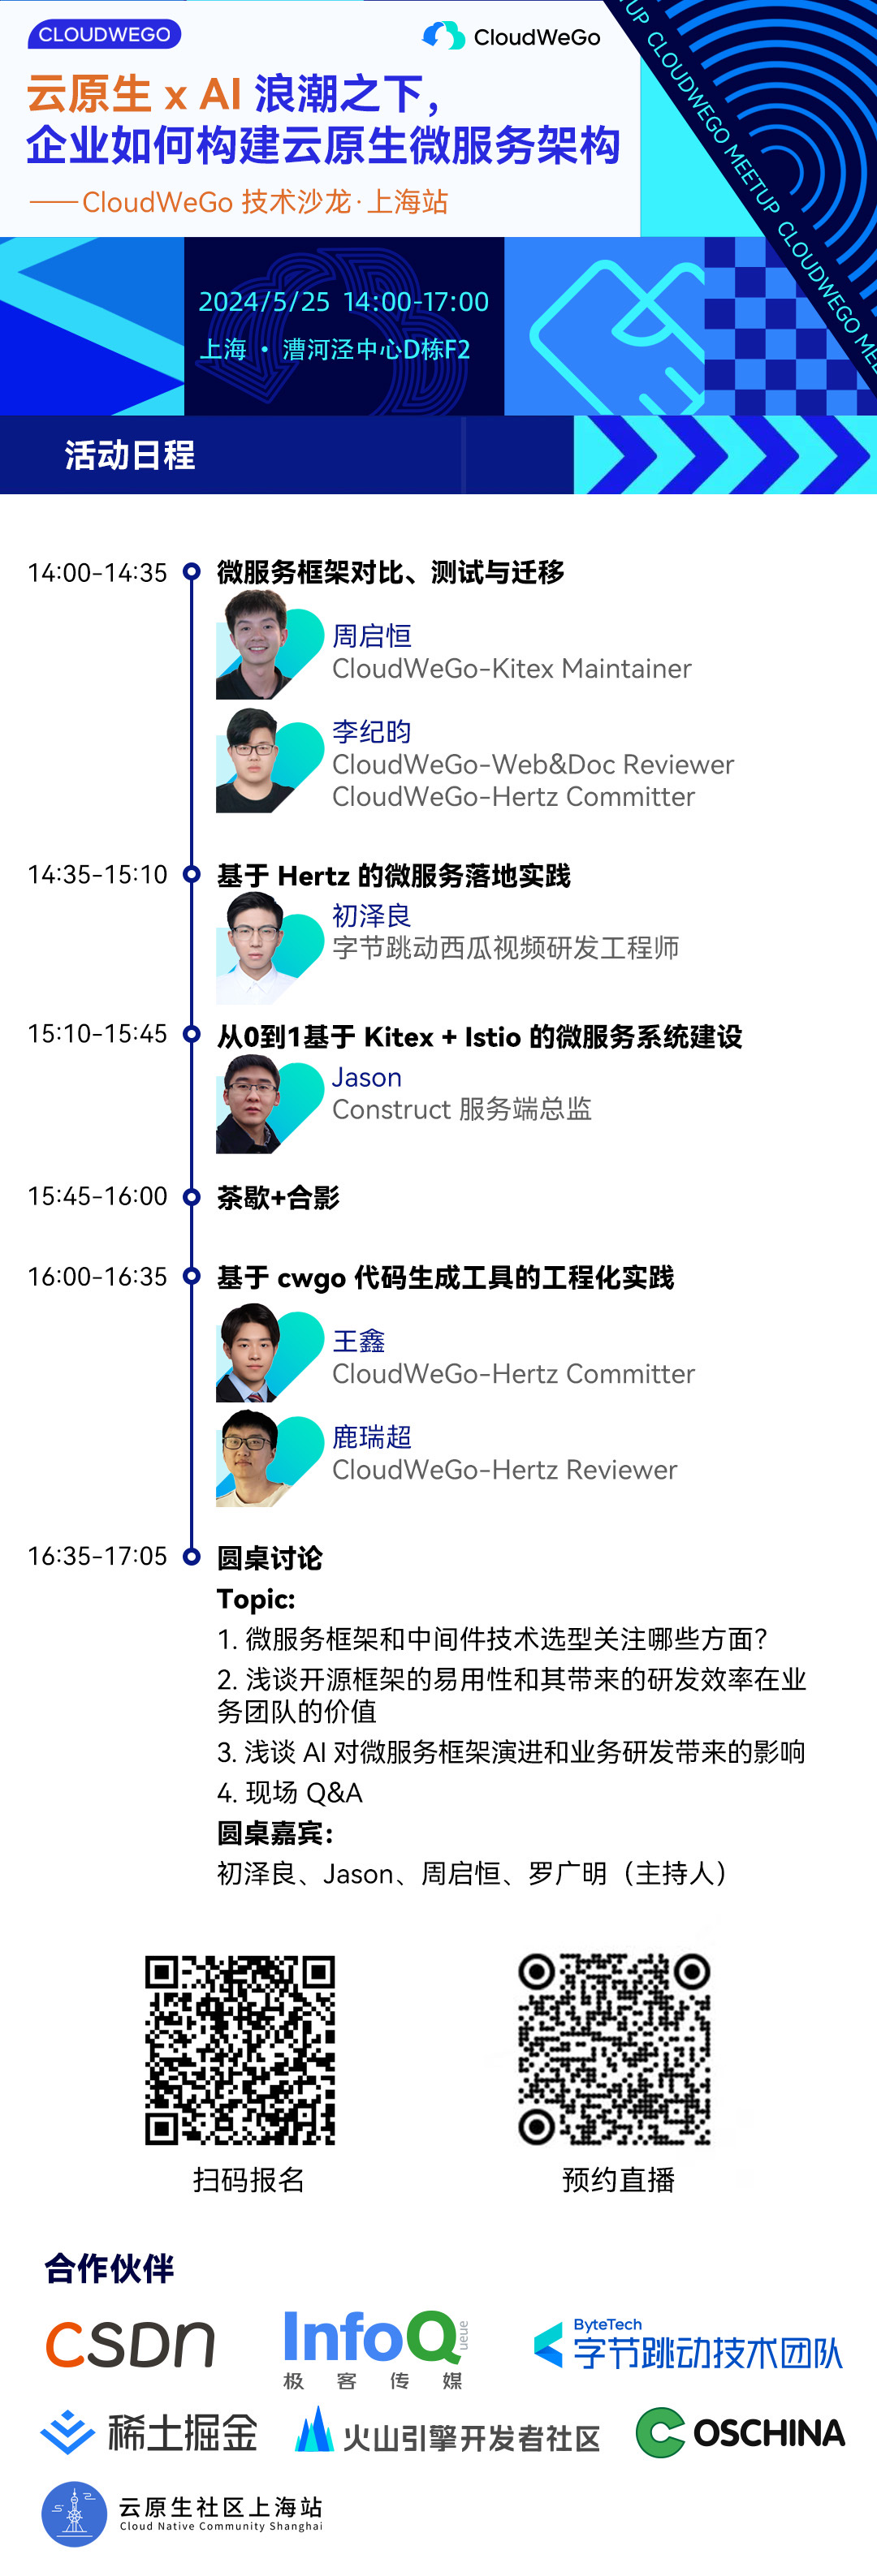
Enterprise users and developers are sincerely invited to participate in the CloudWeGo Technology Salon. The event will be held in Shanghai on May 25 , 2024 (Saturday) , inviting technical colleagues to discuss how companies can build a cloud-native microservice architecture to support the rapid iteration and development of products under the wave of cloud-native xAI . Scan the QR code on the picture to sign up immediately, see you there!
The pirated resources of "Celebrating More Than Years 2" were uploaded to npm, causing npmmirror to have to suspend the unpkg service. Microsoft's China AI team collectively packed up and went to the United States, involving hundreds of people. The founder of the first front-end visualization library and Baidu's well-known open source project ECharts - "going to the sea" to support Fish scammers used TeamViewer to transfer 3.98 million! What should remote desktop vendors do? Zhou Hongyi: There is not much time left for Google. It is recommended that all products be open source. A former employee of a well-known open source company broke the news: After being challenged by his subordinates, the technical leader became furious and fired the pregnant female employee. Google showed how to run ChromeOS in an Android virtual machine. Please give me some advice. , what role does time.sleep(6) here play? Microsoft responds to rumors that China's AI team is "packing for the United States" People's Daily Online comments on office software's matryoshka-like charging: Only by actively solving "sets" can we have a future