ELK
https://www.elastic.co/what-is/elk-stack
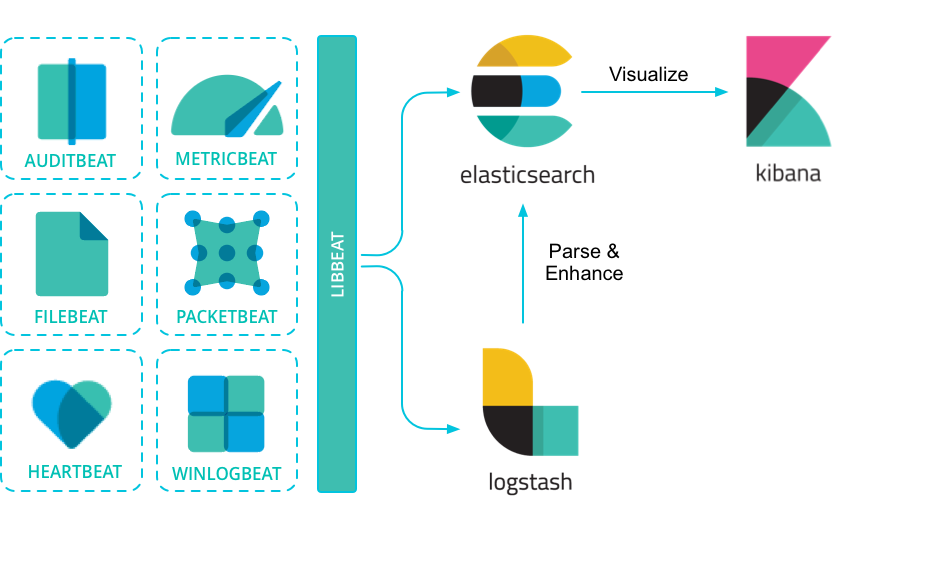
So, what is the ELK Stack? "ELK" is the acronym for three open source projects: Elasticsearch, Logstash, and Kibana. Elasticsearch is a search and analytics engine. Logstash is a server‑side data processing pipeline that ingests data from multiple sources simultaneously, transforms it, and then sends it to a "stash" like Elasticsearch. Kibana lets users visualize data with charts and graphs in Elasticsearch.
The Elastic Stack is the next evolution of the ELK Stack.
Beats
对于仅仅需要监控数据新增需求的场景, 引入Beats, tail有尾行的意思。
Then we dropped a Beat on ELK
"I just want to tail a file," users said. And we listened. In 2015, we introduced a family of lightweight, single-purpose data shippers into the ELK Stack equation. We called them Beats.
Elasitc Stack
随着技术栈的变更 ELK 不能表达所有的成分, 引入 Elastic Stack概念
So, where did that leave ELK?
In a funny position, really. Do we call it BELK? BLEK? ELKB? The threat of acronym alphabet soupification was real. For a stack so scalable, the acronym really wasn't.
Enter, the Elastic Stack
The same open source products users know and love, only better integrated, more powerful, easier to get started with, and brimming with possibility.
Beats Main
https://www.elastic.co/beats/
Lightweight data shippers
Beats is a free and open platform for single-purpose data shippers. They send data from hundreds or thousands of machines and systems to Logstash or Elasticsearch.
除了官方的几个Beats,还有很多社区Beats, Beats是基于go开发。
https://www.elastic.co/guide/en/beats/libbeat/current/beats-reference.html
https://www.elastic.co/guide/en/beats/libbeat/current/community-beats.html
FileBeats - Concept
https://www.elastic.co/guide/en/beats/filebeat/5.5/filebeat-overview.html
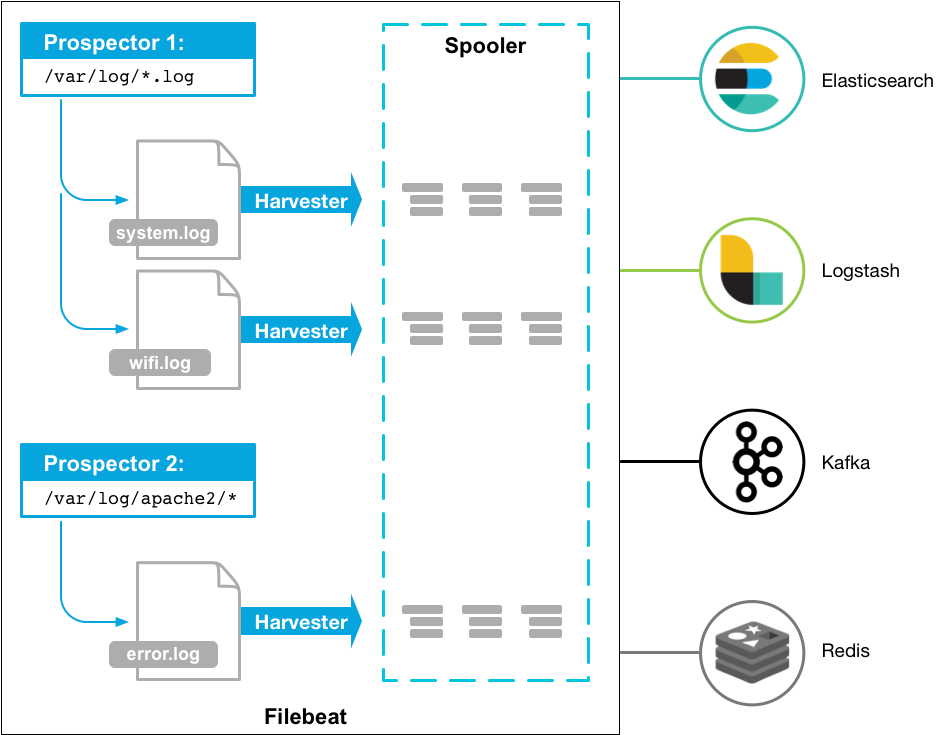
监控本地文件, 并把文件的变化传送到 Elasticsearch, 或者logstash进行深加工。
Filebeat is a log data shipper for local files. Installed as an agent on your servers, Filebeat monitors the log directories or specific log files, tails the files, and forwards them either to Elasticsearch or Logstash for indexing.
Here’s how Filebeat works: When you start Filebeat, it starts one or more prospectors that look in the local paths you’ve specified for log files. For each log file that the prospector locates, Filebeat starts a harvester. Each harvester reads a single log file for new content and sends the new log data to the spooler, which aggregates the events and sends the aggregated data to the output that you’ve configured for Filebeat.
FileBeats - Config
Define the path (or paths) to your log files.
For the most basic Filebeat configuration, you can define a single prospector with a single path. For example:
filebeat.prospectors:
- input_type: log paths:  - /var/log/*.log
The prospector in this example harvests all files in the path
/var/log/*.log, which means that Filebeat will harvest all files in the directory/var/log/that end with.log. All patterns supported by Golang Glob are also supported here.To fetch all files from a predefined level of subdirectories, the following pattern can be used:
/var/log/*/*.log. This fetches all.logfiles from the subfolders of/var/log. It does not fetch log files from the/var/logfolder itself. Currently it is not possible to recursively fetch all files in all subdirectories of a directory.If you are sending output to Elasticsearch, set the IP address and port where Filebeat can find the Elasticsearch installation:
output.elasticsearch:
  hosts: ["192.168.1.42:9200"]
FileBeats - modules
https://www.elastic.co/guide/en/beats/filebeat/5.5/filebeat-modules-overview.html
Filebeat modules simplify the collection, parsing, and visualization of common log formats.
A typical module (say, for the Nginx logs) is composed of one or more filesets (in the case of Nginx,
accessanderror). A fileset contains the following:
- Filebeat prospector configurations, which contain the default paths where to look or the log files. These default paths depend on the operating system. The Filebeat configuration is also responsible with stitching together multiline events when needed.
- Elasticsearch Ingest Node pipeline definition, which is used to parse the log lines.
- Fields definitions, which are used to configure Elasticsearch with the correct types for each field. They also contain short descriptions for each of the fields.
- Sample Kibana dashboards, which can be used to visualize the log files.
Filebeat automatically adjusts these configurations based on your environment and loads them to the respective Elastic stack components.
./filebeat -e -modules=system,nginx,mysql -setup
如下为 apache日志分析的一个模块实例
https://github.com/elastic/examples/tree/master/Common%20Data%20Formats/apache_logs