Elastic Stack是指Elasticsearch、Logstash 、 Kibana和Beats。

1、Beats
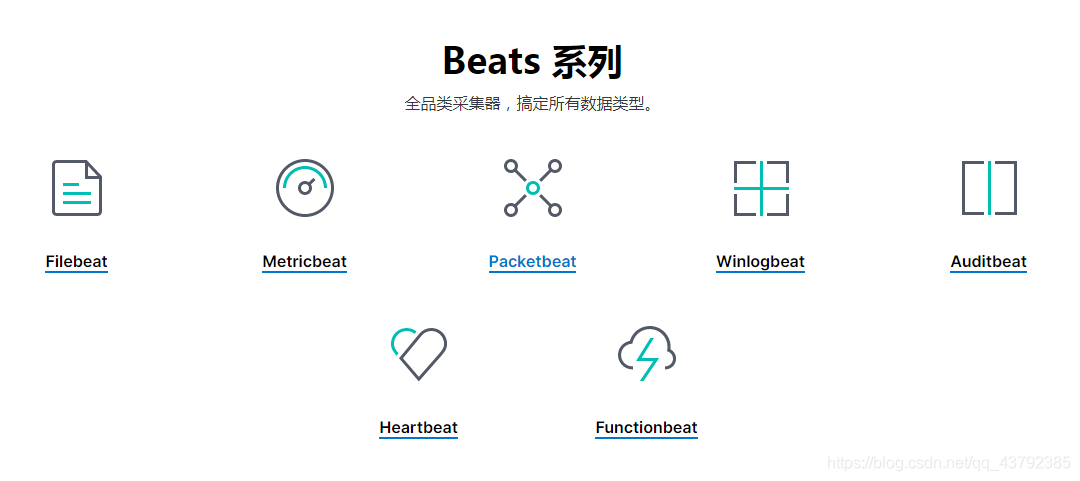
Beats 是轻量的数据采集工具,集合了多种单一用途数据采集器。它们从成百上千或成千上万台机器和系统向 Logstash 或 Elasticsearch 发送数据。

1.1、FileBeat
FileBeat是轻量型日志采集器。当您要面对成百上千、甚至成千上万的服务器、虚拟机和容器生成的日志时,请告别 SSH 吧。Filebeat 将为您提供一种轻量型方法,用于转发和汇总日志与文件,让简单的事情不再繁杂。
Filebeat 内置有多种模块(auditd、Apache、NGINX、System、MySQL 等等),可针对常见格式的日志大大简化收集、解析和可视化过程,只需一条命令即可。之所以能实现这一点,是因为它将自动默认路径(因操作系统而异)与 Elasticsearch 采集节点管道的定义和 Kibana 仪表板组合在一起。不仅如此,数个 Filebeat 模块还包括预配置的 Machine Learning 任务。
1.1.1 部署
下载(版本为:filebeat-6.5.4):https://www.elastic.co/downloads/beats
tar -xvf filebeat-6.5.4-linux-x86_64.tar.gz
cd filebeat-6.5.4-linux-x86_64
#创建如下配置文件 test.yml
filebeat.inputs:
- type: stdin
enabled: true
setup.template.settings:
index.number_of_shards: 3
output.console:
pretty: true
enable: true
#启动filebeat
./filebeat -e -c test.yml
#输入hello运行结果如下:
hello
{
 "@timestamp": "2019-11-01T12:50:03.585Z",
 "@metadata": { #元数据信息
  "beat": "filebeat",
  "type": "doc",
  "version": "6.5.4"
},
 "source": "",
 "offset": 0,
 "message": "hello",  #输入的内容
 "prospector": { #标准输入勘探器
  "type": "stdin"
},
 "input": {  #控制台标准输入
  "type": "stdin"
},
 "beat": { #beat版本以及主机信息
  "name": "qqxhb",
  "hostname": "qqxhb",
  "version": "6.5.4"
},
 "host": {
  "name": "qqxhb"
}
}
1.1.2 读取日志文件
# 配置读取文件项 test-log.yml
filebeat.inputs:
- type: log
enabled: true
paths:
- /test/beats/logs/*.log
setup.template.settings:
index.number_of_shards: 3
output.console:
pretty: true
enable: true
#启动filebeat
./filebeat -e -c test-log.yml
#/test/beats/logs下创建a.log文件,并输入如下内容
hello
#观察filebeat输出
{
 "@timestamp": "2019-11-01T14:16:10.192Z",
  "@metadata": {
  "beat": "filebeat",
  "type": "doc",
  "version": "6.5.4"
},
 "host": {
  "name": "qqxhb"
},
 "source": "/test/beats/logs/a.log",
 "offset": 0,
 "message": "hello",
 "prospector": {
  "type": "log"
},
 "input": {
  "type": "log"
},
 "beat": {
  "version": "6.5.4",
  "name": "qqxhb",
  "hostname": "qqxhb"
}
}
1.1.3 添加自定义字段
# 配置读取文件项 test-log.yml
filebeat.inputs:
- type: log
enabled: true
paths:
- /test/beats/logs/*.log
tags: ["web"]  #添加自定义tag,便于后续的处理
fields:  #添加自定义字段
 from: test-web
fields_under_root: true #true为添加到根节点,false为添加到子节点中
setup.template.settings:
index.number_of_shards: 3
output.console:
pretty: true
enable: true
#启动filebeat
./filebeat -e -c test-log.yml
#/test/beats/logs下创建a.log文件,并输入如下内容
hello
#观察filebeat输出
{
 "@timestamp": "2019-11-01T14:16:10.192Z",
  "@metadata": {
  "beat": "filebeat",
  "type": "doc",
  "version": "6.5.4"
},
 "host": {
  "name": "qqxhb"
},
 "source": "/test/beats/logs/a.log",
 "offset": 0,
 "tags": [
  "web"
],
 "message": "hello",
 "prospector": {
  "type": "log"
},
 "input": {
  "type": "log"
},
"from": "test-web",
 "beat": {
  "version": "6.5.4",
  "name": "qqxhb",
  "hostname": "qqxhb"
}
}
1.1.4 输出到Elasticsearch
# test-log.yml
filebeat.inputs:
- type: log
enabled: true
paths:
 - /test/beats/logs/*.log
setup.template.settings:
index.number_of_shards: 3 #指定索引的分区数
output.elasticsearch: #指定ES的配置
hosts: ["192.168.1.7:9200","192.168.1.7:9201","192.168.1.7:9202"]
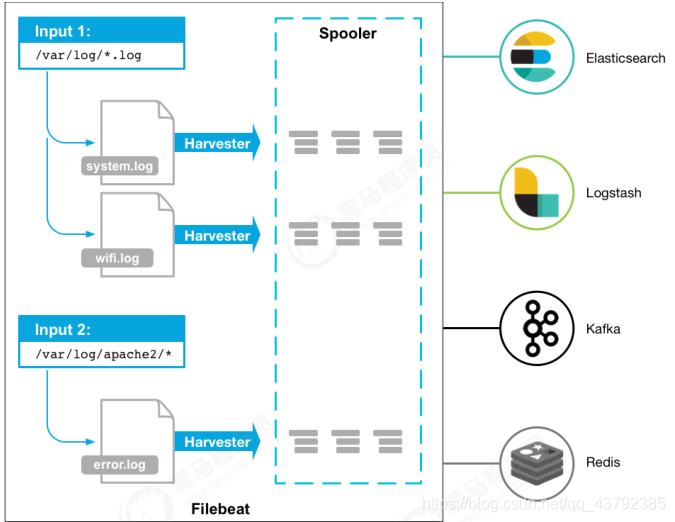
1.1.5 Filebeat工作原理
Filebeat由两个主要组件组成:prospector 和 harvester。
harvester :负责读取单个文件的内容。如果文件在读取时被删除或重命名, Filebeat将继续读取文件。
prospector: 负责管理harvester并找到所有要读取的文件来源。如果输入类型为日志,则查找器将查找路径匹配的所有文件,并为每个文件启动一个 harvester。Filebeat 目前支持两种prospector类型:log和stdin。
Filebeat 如何保持文件的状态:Filebeat 保存每个文件的状态并经常将状态刷新到磁盘上的注册文件中。该状态用于记住 harvester正在读取的最后偏移量,并确保发送所有日志行。如果输出(例如 Elasticsearch或Logstash)无法访问,Filebeat会跟踪最后发送的行,并在输出再次可用时继续读取文件。在 Filebeat运行时,每个prospector内存中也会保存的文件状态信息,当重新启动Filebeat时,将使用注册文件的数据来重建文件状态,Filebeat将每个harvester在从保存的最后偏移量继续读取。文件状态记录在 data/registry文件中。
./filebeat  -e -c test.yml
./filebeat -e -c test.yml -d "publish"
#参数说明
-e: 输出到标准输出,默认输出到syslog和logs下
-c: 指定配置文件
-d: 输出debug信息
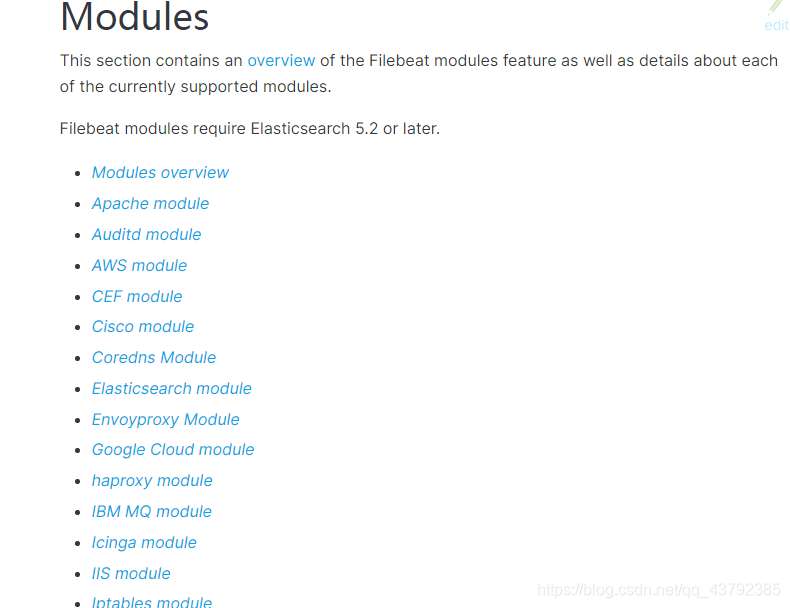
1.1.6 Module
前面要想实现日志数据的读取以及处理都是自己手动配置的,其实,在Filebeat中,有大量的Module,可以简化我们的配置,直接就可以使用,如下:https://www.elastic.co/guide/en/beats/filebeat/current/filebeat-modules.html
./filebeat modules list
Enabled:
Disabled:
apache2
auditd
elasticsearch
haproxy
icinga
iis
kafka
kibana
logstash
mongodb
mysql
nginx
osquery
postgresql
redis
suricata
system
traefik
可以看到,内置了很多的module,但是都没有启用,如果需要启用需要进行enable操作:
./filebeat modules enable redis  #启动
./filebeat modules disable redis #禁用
redis module目录:
.
├── log  #日志
│  ├── config
│  │  └── log.yml
│  ├── ingest
│  │  └── pipeline.json
│  └── manifest.yml
├── module.yml
└── slowlog #慢查询日志
 ├── config
 │  └── slowlog.yml
 ├── ingest
 │  └── pipeline.json
 └── manifest.yml
redis module 配置
cd modules.d/
vim redis.yml
- module: redis
 # Main logs
log:
 enabled: true
  # Set custom paths for the log files. If left empty,
  # Filebeat will choose the paths depending on your OS.
 var.paths: ["/data/redis-data/node01/*.log"]
 # Slow logs, retrieved via the Redis API (SLOWLOG)
slowlog:
 enabled: false
  # The Redis hosts to connect to.
  #var.hosts: ["localhost:6379"]
修改redis的docker容器:redis默认情况下,是不会输出日志的。
docker create  --name redis-node01 -v /data/redis-data/node01:/data -p 6379:6379
redis:5.0.2 --cluster-enabled yes --cluster-config-file nodes-node-01.conf --loglevel
debug --logfile nodes-node-01.log
docker create --name redis-node02 -v /data/redis-data/node02:/data -p 6380:6379
redis:5.0.2 --cluster-enabled yes --cluster-config-file nodes-node-02.conf --loglevel
debug --logfile nodes-node-02.log
docker create --name redis-node03 -v /data/redis-data/node03:/data -p 6381:6379
redis:5.0.2 --cluster-enabled yes --cluster-config-file nodes-node-03.conf --loglevel
debug --logfile nodes-node-03.log
loglevel 日志等级分为:debug、verbose、notice、warning
其中,debug 会有大量信息,对开发、测试有用;
verbose 等于log4j 中的info,有很多信息,但是不会像debug那样乱;
notice 一般信息;
warning 只有非常重要/关键的消息被记录。扫描二维码关注公众号,回复: 9393692 查看本文章
配置filebeat
#vim test-redis.yml
filebeat.inputs:
- type: log
enabled: true
paths:
  - /test/log/*.log
setup.template.settings:
index.number_of_shards: 3
output.console:
pretty: true
enable: true
filebeat.config.modules:
path: ${path.config}/modules.d/*.yml
reload.enabled: false
测试:./filebeat -e -c test-redis.yml --modules redis
1.2 Metricbeat
Metricbeat是轻量型指标采集器,用于从系统和服务收集指标。Metricbeat 能够以一种轻量型的方式,输送各种系统和服务统计数据,从 CPU 到内存,从 Redis 到 Nginx,系统到容器,都可以监测。
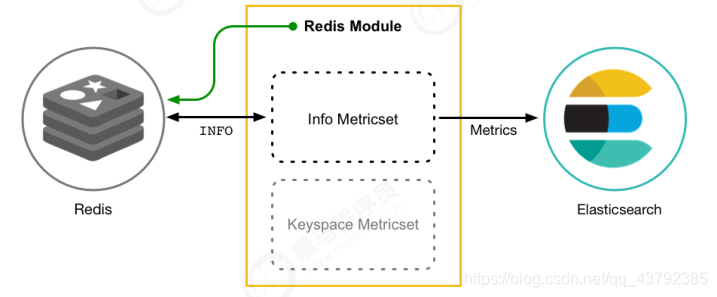
1.2.1 Metricbeat组成
Metricbeat有2部分组成,一部分是Module,另一部分为Metricset。
Module收集的对象,如: mysql、redis、操作系统等;
Metricset收集指标的集合,如: cpu、memory、network等;
1.2.2 部署与收集系统指标
tar  -xvf metricbeat-6.5.4-linux-x86_64.tar.gz
cd metricbeat-6.5.4-linux-x86_64
vim metricbeat.yml
metricbeat.config.modules:
path:  ${path.config}/modules.d/*.yml
reload.enabled: false
setup.template.settings:
index.number_of_shards: 1
index.codec: best_compression
setup.kibana:
output.elasticsearch:
hosts: ["192.168.1.7:9200","192.168.1.7:9201","192.168.1.7:9202"]
processors:
 - add_host_metadata: ~
 - add_cloud_metadata: ~
#启动
./metricbeat -e
system module 配置:
# Module: system
# Docs: https://www.elastic.co/guide/en/beats/metricbeat/6.5/metricbeat-module-
system.html
- module: system
period: 10s
metricsets:
 - cpu
 - load
 - memory
 - network
 - process
 - process_summary
  #- core
  #- diskio
  #- socket
process.include_top_n:
 by_cpu: 5    # include top 5 processes by CPU
 by_memory: 5  # include top 5 processes by memory
- module: system
period: 1m
metricsets:
 - filesystem
 - fsstat
processors:
- drop_event.when.regexp:
  system.filesystem.mount_point: '^/(sys|cgroup|proc|dev|etc|host|lib)($|/)'
- module: system
period: 15m
metricsets:
 - uptime
#- module: system
# period: 5m
# metricsets:
#  - raid
# raid.mount_point: '/'
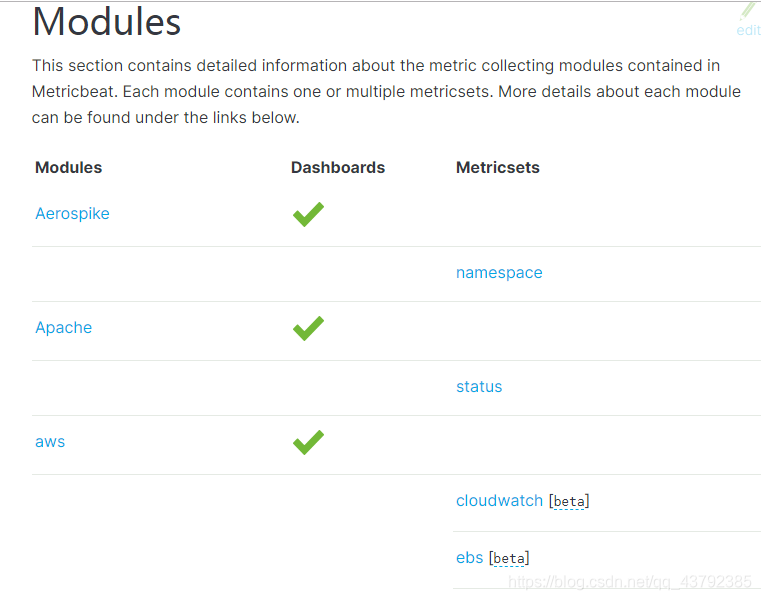
1.2.3 Models
官网:https://www.elastic.co/guide/en/beats/metricbeat/current/metricbeat-modules.html
测试Redis Module:
# 启用redis module
./metricbeat modules enable redis
#修改redis module配置
vim modules.d/redis.yml
- module: redis
metricsets:
  - info
 # - keyspace
period: 10s
 # Redis hosts
hosts: ["192.168.1.7:6379","192.168.1.7:6380","192.168.1.7:6381"]
 # Network type to be used for redis connection. Default: tcp
 #network: tcp
 # Max number of concurrent connections. Default: 10
 #maxconn: 10
 # Redis AUTH password. Empty by default.
 #password: foobared
#启动
./metricbeat -e
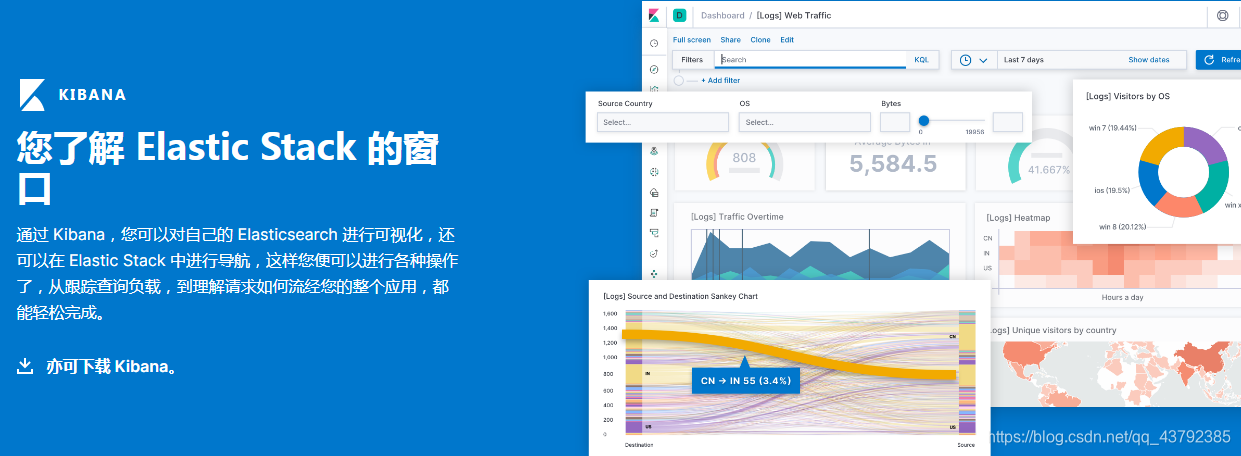
2、Kibana
Kibana 是一款开源的数据分析和可视化平台,它是 Elastic Stack 成员之一,设计用于和 Elasticsearch 协作。您可以使用 Kibana 对 Elasticsearch 索引中的数据进行搜索、查看、交互操作。您可以很方便的利用图表、表格及地图对数据进行多元化的分析和呈现。
官网:https://www.elastic.co/cn/products/kibana
2.1、配置安装
# 解压安装包
tar -xvf kibana-6.5.4-linux-x86_64.tar.gz
#修改配置文件
vim config/kibana.yml
server.host: "192.168.1.7"  #对外暴露服务的地址
elasticsearch.url: "http://192.168.1.7:9200"  #配置Elasticsearch
#启动
./bin/kibana
#通过浏览器进行访问
http://192.168.1.7:5601/app/kibana
2.2、通过docker部署
# 拉取镜像
docker pull kibana:6.5.4
#创建配置文件
vim kibana.yml
server.host: "192.168.1.7"
elasticsearch.url: "http://192.168.1.7:9200"
#创建容器
docker create --name kibana --net host -v /test/beats/kibana-
docker/kibana.yml:/usr/share/kibana/config/kibana.yml kibana:6.5.4
#启动容器
docker logs -f kibana
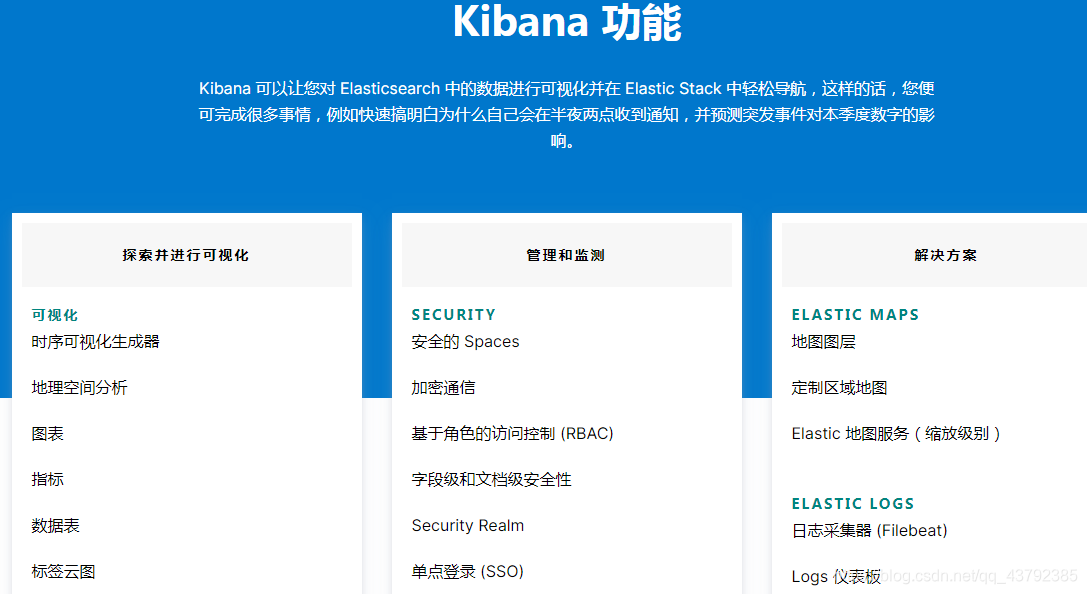
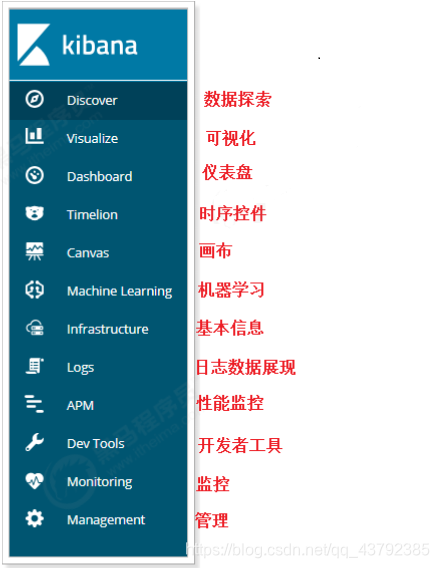
2.3、功能说明
官网:https://www.elastic.co/cn/products/kibana/features
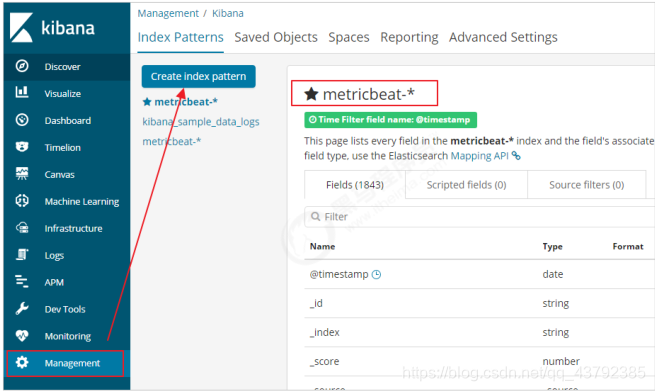
2.4 、数据探索
添加索引信息:
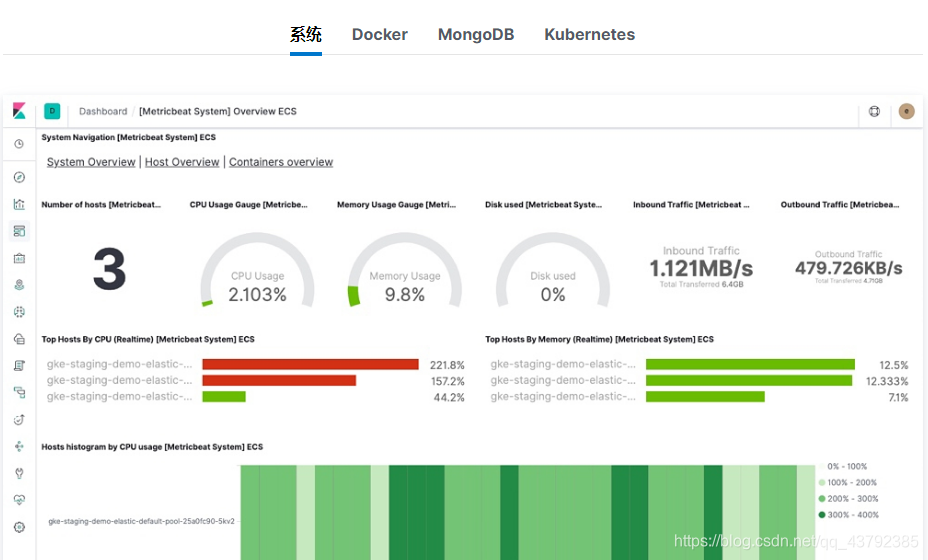
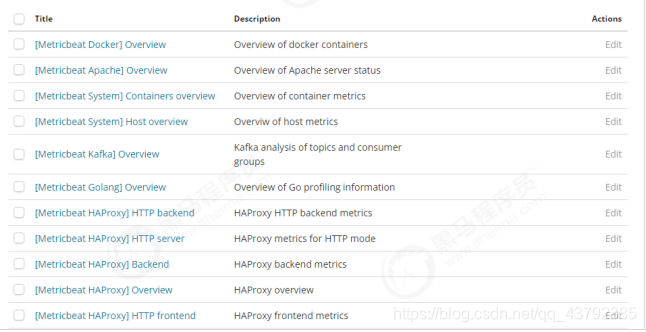
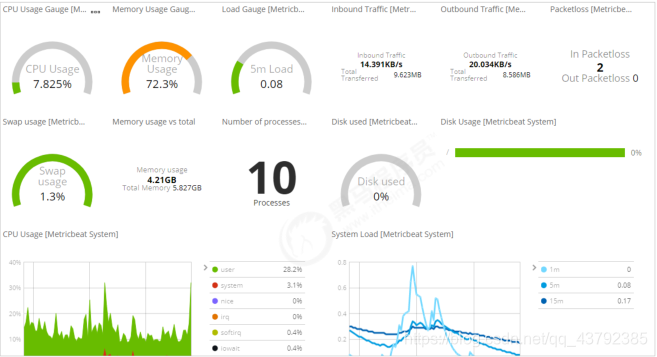
2.5 、Metricbeat 仪表盘
可以将Metricbeat的数据在Kibana中展示。
# 修改metricbeat配置
setup.kibana:
host: "192.168.1.7:5601"
#安装仪表盘到Kibana
./metricbeat setup --dashboards
即可在Kibana中看到仪表盘数据:
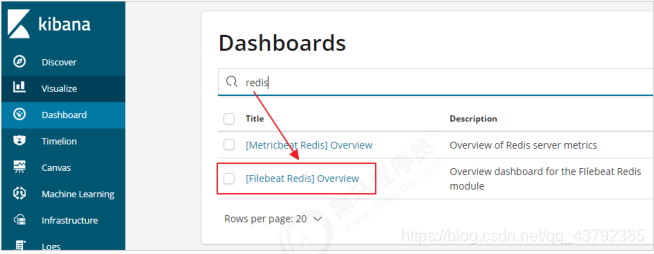
2.6 、Filebeat 仪表盘
以Redis为例:
# 修改配置文件
filebeat.inputs:
- type: log
enabled: true
paths:
  - /test/log/*.log
setup.template.settings:
index.number_of_shards: 3
filebeat.config.modules:
path: ${path.config}/modules.d/*.yml
reload.enabled: false
output.elasticsearch:
hosts: ["192.168.1.7:9200","192.168.1.7:9201","192.168.1.7:9202"]
setup.kibana:
host: "192.168.1.7:5601"
#安装仪表盘到kibana
./filebeat -c test-redis.yml setup
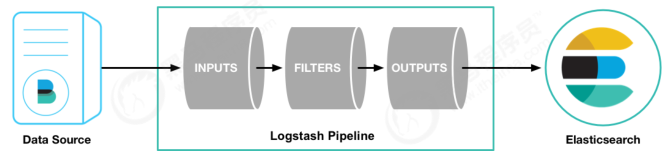
3 、Logstash
3.1、简介

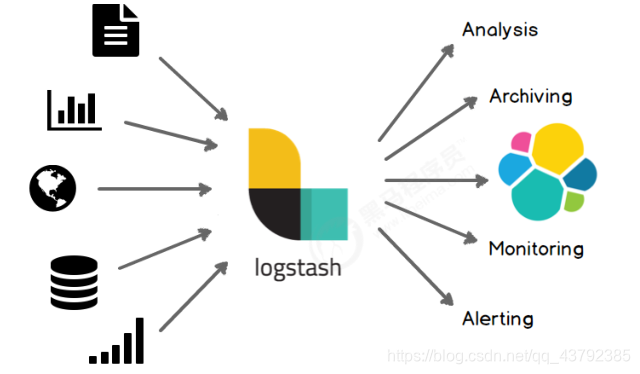
输入渠道:https://www.elastic.co/guide/en/logstash/current/input-plugins.html
输出渠道:https://www.elastic.co/guide/en/logstash/current/output-plugins.html
3.2 、部署安装
# 检查jdk环境,要求jdk1.8+
java -version
#解压安装包
tar -xvf logstash-6.5.4.tar.gz
#第一个logstash示例
bin/logstash -e 'input { stdin { } } output { stdout {} }'
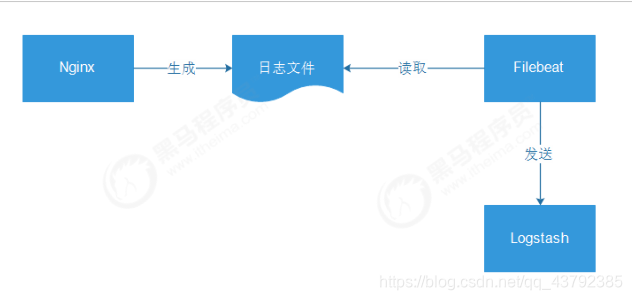
3.3 、接收Filebeat输入的日志
接下来,我们将Filebeat和Logstash整合起来,读取nginx的日志。
安装Nginx
apt install nginx  -y
#/usr/sbin/nginx:主程序
#/etc/nginx:存放配置文件
#/usr/share/nginx:存放静态文件
#/var/log/nginx:存放日志
#nginx服务命令
service nginx {start|stop|restart|reload|force-
reload|status|configtest|rotate|upgrade}
#通过浏览器访问页面并且查看日志
#访问地址:http://192.168.1.7/
tail -f /var/log/nginx/access.log
配置Filebeat
#vim test-nginx.yml
filebeat.inputs:
- type: log
enabled: true
paths:
 - /var/log/nginx/access.log
tags: ["log"]
fields:
 from: nginx
fields_under_root: false
output.logstash:
hosts: ["192.168.1.7:5044"]
#启动
./filebeat -e -c haoke-test.yml
#说明:现在启动会报错,因为Logstash还没有启动
配置Logstash
vim test-pipeline.conf
#输入如下内容:
input {
 beats {
   port => "5044"
 }
}
# The filter part of this file is commented out to indicate that it is
# optional.
# filter {
#
# }
output {
 stdout { codec => rubydebug }
}
#启动 --config.test_and_exit 用于测试配置文件是否正确
bin/logstash -f test-pipeline.conf --config.test_and_exit
#[INFO ][logstash.runner     ] Using config.test_and_exit mode. Config
Validation Result: OK. Exiting Logstash
#正式启动 --config.reload.automatic 热加载配置文件,修改配置文件后无需重新启动
bin/logstash -f test-pipeline.conf --config.reload.automatic
分别启动Filebeat和Logstash,刷新页面查看输出。
{
  "@timestamp" => 2019-11-01T12:23:37.604Z,
    "fields" => {
    "from" => "nginx"
 },
    "source" => "/var/log/nginx/access.log",
     "tags" => [
   [0] "log",
   [1] "beats_input_codec_plain_applied"
 ],
     "host" => {
    "name" => "qqxhb"
 },
     "beat" => {
      "name" => "qqxhb",
    "version" => "6.5.4",
    "hostname" => "qqxhb"
 },
   "@version" => "1",
    "offset" => 600,
   "message" => "192.168.1.20 - - [01/Nov/2019:20:23:35 +0800] \"GET / HTTP/1.1\"
304 0 \"-\" \"Mozilla/5.0 (Windows NT 6.3; Win64; x64) AppleWebKit/537.36 (KHTML,
like Gecko) Chrome/70.0.3538.67 Safari/537.36\"",
    "input" => {
    "type" => "log"
 },
  "prospector" => {
    "type" => "log"
 }
}
配置filter
在前面的输出中,可以看出,虽然可以拿到日志信息,但是信息格式并不友好,比如说,不能直接拿到日志中的ip地址。
自定义nginx的日志格式
vim /etc/nginx/nginx.conf
log_format main '$remote_addr - $remote_user [$time_local] '
'"$request" $status $body_bytes_sent '
'"$http_referer" "$http_user_agent"';
access_log /var/log/nginx/access.log main;
nginx -s reload
编写nginx-patterns文件
NGINX_ACCESS %{IPORHOST:remote_addr}  - %{USERNAME:remote_user} \[%
{HTTPDATE:time_local}\] \"%{DATA:request}\" %{INT:status} %{NUMBER:bytes_sent} \"%
{DATA:http_referer}\" \"%{DATA:http_user_agent}\"
修改test-pipeline.conf文件
input {
 beats {
   port => "5044"
 }
}
filter {
 grok {
   patterns_dir => "/test/logstash-6.5.4/nginx-patterns"
   match => { "message" => "%{NGINX_ACCESS}"}
   remove_tag => [ "_grokparsefailure" ]
   add_tag => [ "nginx_access" ]
 }
}
output {
 stdout { codec => rubydebug }
}
发送到Elasticsearch
#vim test-pipeline.conf
input {
 beats {
   port => "5044"
 }
}
filter {
 grok {
   patterns_dir => "/test/logstash-6.5.4/nginx-patterns"
   match => { "message" => "%{NGINX_ACCESS}"}
   remove_tag => [ "_grokparsefailure" ]
   add_tag => [ "nginx_access" ]
 }
}
#output {
#  stdout { codec => rubydebug }
#}
output {
 elasticsearch {
   hosts => [ "192.168.1.7:9200","192.168.1.7:9201","192.168.1.7:9202" ]
 }
}
