对曲线下面或者曲线之间的区域进行填充
用fill、fill_between函数
import numpy as np
import matplotlib.pyplot as plt
x = np.linspace(0, 5*np.pi, 1000)
y1 = np.sin(x)
y2 = np.sin((2*x))
plt.plot(x, y1)
plt.plot(x, y2)
plt.fill(x, y1, 'b', alpha=0.2)
plt.fill(x, y2, 'r', alpha=0.2)
plt.show()
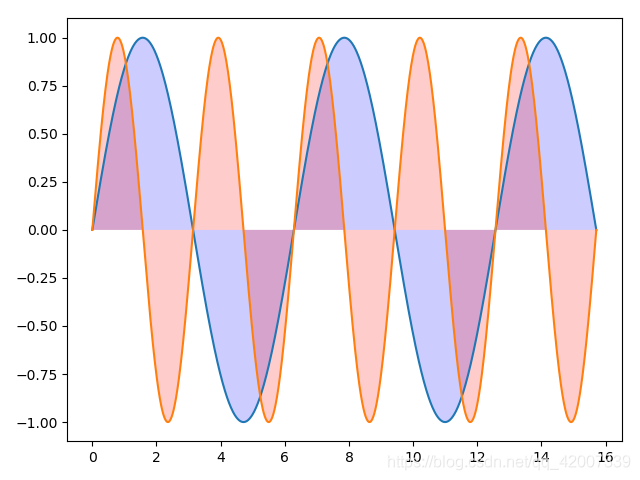
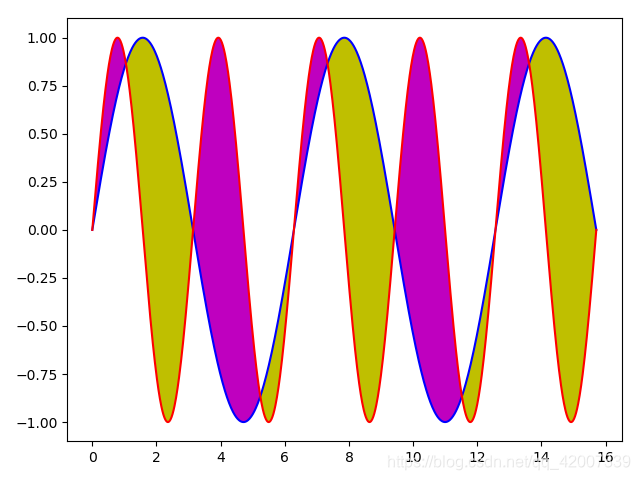
fig = plt.figure()
ax = fig.add_subplot(111)
ax.plot(x, y1, 'b')
ax.plot(x, y2, 'r')
ax.fill_between(x, y1, y2, where=y1 > y2, facecolor='y', interpolate=True)
ax.fill_between(x, y1, y2, where=y1 < y2, facecolor='m', interpolate=True)
#where是条件,interpolate是填充满
plt.show()