前言
时间序列特征提取包中tsfresh较为流行,但是其官方教程给出的例子是机器人故障的数据集,其中的id列为各组不同的实验。然后我就一直在想能否做单类的,比如电力预测,或者是某一条街道的交通预测,但是翻遍了文档都没找到,后来在github项目文件中找到了做单类预测的示例文件
我当时有这个想法的时候查过CSDN上的其他有关tsfresh包的教程,大多都是搬运的官方文档的例子,没有单类预测的示例,下面我将结合代码,说明如何提取该类型的时间序列特征。
时序特征提取
导入必要包
import numpy as np
import pandas as pd
import matplotlib.pylab as plt

from tsfresh import extract_features, select_features
from tsfresh.utilities.dataframe_functions import roll_time_series, make_forecasting_frame
from tsfresh.utilities.dataframe_functions import impute

import pandas_datareader.data as web
from sklearn.linear_model import LinearRegression
准备数据集
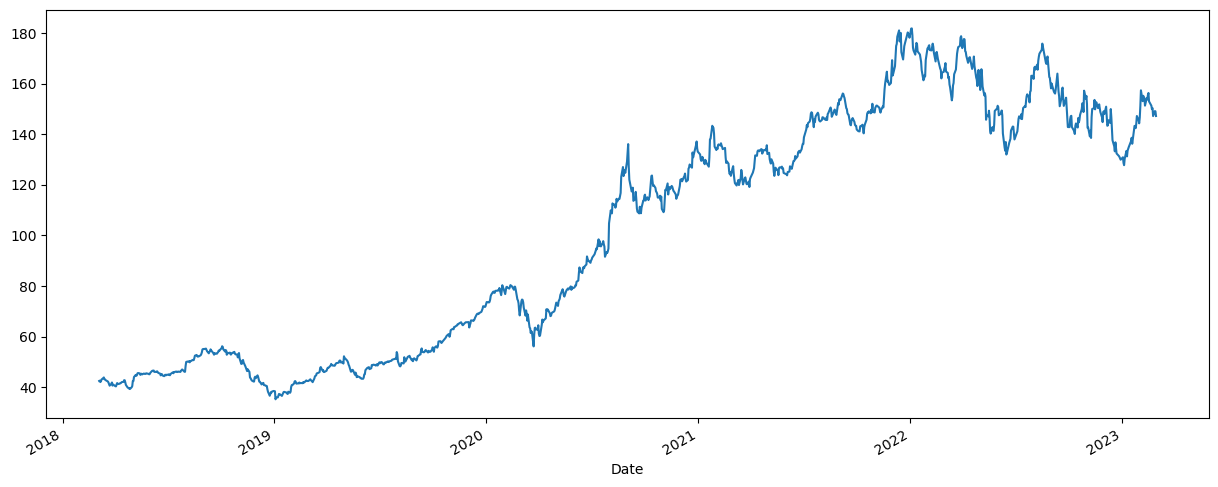
- 我们将使用苹果公司的股票价格来展示如何同时处理一个时间序列(一只股票)。
- 我们从 "stooq "下载数据,只存储高值。
df = web.DataReader("AAPL", 'stooq')["High"]
print(df.shape)
df.head()
输出:
(1257,)
Date
2023-03-01    147.2285
2023-02-28    149.0800
2023-02-27    149.1700
2023-02-24    147.1900
2023-02-23    150.3400
Name: High, dtype: float64
- 绘制图形观察
plt.figure(figsize=(15, 6))
df.plot(ax=plt.gca())
plt.show()
- 整理数据集,添加标识符:
df_melted = pd.DataFrame({

    "high": df.copy()})
df_melted["date"] = df_melted.index
df_melted["Symbols"] = "AAPL"

df_melted.head()
输出:
	high	date	Symbols
Date
2023-03-01	147.2285	2023-03-01	AAPL
2023-02-28	149.0800	2023-02-28	AAPL
2023-02-27	149.1700	2023-02-27	AAPL
2023-02-24	147.1900	2023-02-24	AAPL
2023-02-23	150.3400	2023-02-23	AAPL
创建训练数据样本
- 预测通常包括以下步骤:
- 收集到今天为止的的数据
- 进行特征提取(例如,使用
extract_features函数) - 训练一个预测模型
- 然而在训练中,我们需要多个例子来训练。如果我们只使用到今天为止的时间序列,我们将只有一个训练实例。因此,我们使用了一个技巧:滑动历史窗口。
- 想象一下有一个滑动的时间窗口在你的数据集上,在每个时间步长 t t t,你把窗口中的数据当作今天(包括 t t t)的数据来提取特征。直到时间 t t t的特征的目标是时间 t + 1 t+1 t+1的时间值。
- 窗口滑动的过程是在函数
roll_time_series中实现的。我们的窗口大小为20(即看的是过去最多20天的情况),我们不考虑所有短于5天的窗口。
df_rolled = roll_time_series(df_melted, column_id="Symbols", column_sort="date",max_timeshift=20, min_timeshift=5)
df_rolled.head()
输出:
Rolling: 100%|██████████| 10/10 [00:02<00:00,  3.71it/s]
high	date	Symbols	id
0	42.4266	2018-03-05	AAPL	(AAPL, 2018-03-12 00:00:00)
1	42.5512	2018-03-06	AAPL	(AAPL, 2018-03-12 00:00:00)
2	41.9750	2018-03-07	AAPL	(AAPL, 2018-03-12 00:00:00)
3	42.2771	2018-03-08	AAPL	(AAPL, 2018-03-12 00:00:00)
4	42.9639	2018-03-09	AAPL	(AAPL, 2018-03-12 00:00:00)
- 上面的数据框架由这些 "窗口 "组成,从原始数据框架中印出来。例如,
id = (AAPL,2020-07-14 00:00:00)的数据都来自股票AAPL的原始数据,包括直到2020-07-14的最后20天。 - 挑选出窗口2020-07-14的数据
df_rolled[df_rolled["id"] == ("AAPL", pd.to_datetime("2020-07-14"))]
输出:
	high	date	Symbols	id
12249	85.0954	2020-06-15	AAPL	(AAPL, 2020-07-14 00:00:00)
12250	86.9448	2020-06-16	AAPL	(AAPL, 2020-07-14 00:00:00)
12251	87.4872	2020-06-17	AAPL	(AAPL, 2020-07-14 00:00:00)
12252	87.0066	2020-06-18	AAPL	(AAPL, 2020-07-14 00:00:00)
12253	87.7743	2020-06-19	AAPL	(AAPL, 2020-07-14 00:00:00)
12254	88.4851	2020-06-22	AAPL	(AAPL, 2020-07-14 00:00:00)
12255	91.6684	2020-06-23	AAPL	(AAPL, 2020-07-14 00:00:00)
12256	90.7831	2020-06-24	AAPL	(AAPL, 2020-07-14 00:00:00)
12257	89.8490	2020-06-25	AAPL	(AAPL, 2020-07-14 00:00:00)
12258	89.9277	2020-06-26	AAPL	(AAPL, 2020-07-14 00:00:00)
12259	89.1531	2020-06-29	AAPL	(AAPL, 2020-07-14 00:00:00)
12260	90.0922	2020-06-30	AAPL	(AAPL, 2020-07-14 00:00:00)
12261	90.4312	2020-07-01	AAPL	(AAPL, 2020-07-14 00:00:00)
12262	91.1958	2020-07-02	AAPL	(AAPL, 2020-07-14 00:00:00)
12263	92.5019	2020-07-06	AAPL	(AAPL, 2020-07-14 00:00:00)
12264	93.2027	2020-07-07	AAPL	(AAPL, 2020-07-14 00:00:00)
12265	93.9105	2020-07-08	AAPL	(AAPL, 2020-07-14 00:00:00)
12266	94.8407	2020-07-09	AAPL	(AAPL, 2020-07-14 00:00:00)
12267	94.5077	2020-07-10	AAPL	(AAPL, 2020-07-14 00:00:00)
12268	98.4278	2020-07-13	AAPL	(AAPL, 2020-07-14 00:00:00)
12269	95.7619	2020-07-14	AAPL	(AAPL, 2020-07-14 00:00:00)
提取特征

- 窗口化的数据样本是正确的格式,可以用于tsfreshs的特征提取。像往常一样,特征提取将使用一个给定ID的所有数据,在我们的例子中,就是一个给定窗口和一个给定ID的所有数据(上图中的一个彩色方框)。
X = extract_features(df_rolled.drop("Symbols", axis=1),
                     column_id="id", column_sort="date", column_value="high",
                     impute_function=impute, show_warnings=False)
- 重置索引
X = X.set_index(X.index.map(lambda x: x[1]), drop=True)
X.index.name = "last_date"
X.head()
输出:
	high__variance_larger_than_standard_deviation	high__has_duplicate_max	high__has_duplicate_min	high__has_duplicate	high__sum_values	high__abs_energy	high__mean_abs_change	high__mean_change	high__mean_second_derivative_central	high__median	...	high__permutation_entropy__dimension_6__tau_1	high__permutation_entropy__dimension_7__tau_1	high__query_similarity_count__query_None__threshold_0.0	high__matrix_profile__feature_"min"__threshold_0.98	high__matrix_profile__feature_"max"__threshold_0.98	high__matrix_profile__feature_"mean"__threshold_0.98	high__matrix_profile__feature_"median"__threshold_0.98	high__matrix_profile__feature_"25"__threshold_0.98	high__matrix_profile__feature_"75"__threshold_0.98	high__mean_n_absolute_max__number_of_maxima_7
last_date
2018-03-12	0.0	0.0	0.0	0.0	255.7290	10901.085161	0.452200	0.221720	0.055837	42.48890	...	-0.000000	2.708050	0.0	1.315285	4.197435	2.196965	1.763936	1.3618	2.470387	118.804714
2018-03-13	0.0	0.0	0.0	0.0	299.5324	12819.823012	0.421533	0.229467	0.014360	42.55120	...	0.693147	-0.000000	0.0	1.315285	4.197435	2.196965	1.763936	1.3618	2.470387	118.804714
2018-03-14	0.0	0.0	0.0	0.0	342.6219	14676.528022	0.463300	0.094700	-0.069875	42.75755	...	1.098612	0.693147	0.0	1.315285	4.197435	2.196965	1.763936	1.3618	2.470387	42.949557
2018-03-15	0.0	0.0	0.0	0.0	385.6456	16527.566784	0.413613	0.074637	-0.013600	42.96390	...	1.386294	1.098612	0.0	1.315285	4.197435	2.196965	1.763936	1.3618	2.470387	43.056214
2018-03-16	0.0	0.0	0.0	0.0	428.3982	18355.351591	0.397778	0.036222	-0.024731	42.85825	...	1.609438	1.386294	0.0	1.315285	4.197435	2.196965	1.763936	1.3618	2.470387	43.102786
5 rows × 789 columns
预测
-
我们现在可以使用提取的特征来训练一个模型。但是我们的目标是什么呢?2020-07-13行的目标是下一个时间步长的时间值(在本例中是2020-07-14)。
-
因此,我们需要做的是回到我们的原始数据框架,并使用明天的股票价格做目标值。这是用
shift函数完成的。
y = df_melted.set_index("date").sort_index().high.shift(-1)
输出:
date
2018-03-05     42.5512
2018-03-06     41.9750
2018-03-07     42.2771
2018-03-08     42.9639
2018-03-09     43.5352
                ...
2023-02-23    147.1900
2023-02-24    149.1700
2023-02-27    149.0800
2023-02-28    147.2285
2023-03-01         NaN
Name: high, Length: 1257, dtype: float64
- 然而,我们在这里需要小心一点。X缺少前5个日期(因为我们的最小窗口大小是5),Y缺少最后一个日期(因为今天没有什么可预测的)。所以让我们确保我们对数据有一个一致的看法。
- 使用
isin函数将索引对应起来
y = y[y.index.isin(X.index)]
X = X[X.index.isin(y.index)]
- 我们现在可以训练正常的模型来预测下一个时间步骤。让我们把数据分成训练和测试样本(但要确保保持时间上的一致性)。我们把2019年之前的所有数据作为训练数据,其余的作为测试数据。
X_train = X[:"2018"]
X_test = X["2019":]

y_train = y[:"2018"]
y_test = y["2019":]
- 特征选择
X_train_selected = select_features(X_train, y_train)
后记
- 后面的特征选择和模型预测环节我就不写了,因为示例代码采用的非常简单的模型,得到的结果也不算很理想。
- 官方的示例代码地址在这里,感兴趣的可以看看