Install
-
假设你的PC已经装了python开发环境:
## 使用pip直接安装
pip install tsfresh

## 测试是否安装成功
from tsfresh import extract_features
-
如果还没装python环境,建议安装Anaconda,可参考:https://blog.csdn.net/houchaoqun_xmu/article/details/65629050
-
requirements.txt(使用pip安装时,会自动安装 requirements 所需的环境)
requests>=2.9.1
numpy>=1.10.4
pandas>=0.20.3
scipy>=0.17.0
statsmodels>=0.8.0  ## 基于 statsmodels 框架
patsy>=0.4.1
scikit-learn>=0.17.1
future>=0.16.0
six>=1.10.0
tqdm>=4.10.0
ipaddress>=1.0.18; python_version <= '2.7'
dask>=0.15.2
distributed>=1.18.3
基本步骤
reference:https://blog.csdn.net/takethevow/article/details/80171440
-
准备数据:需要处理的时间序列数据,女装项目就是时间与gmv的数据;
-
特征提取:extract_features
-
特征过滤:过滤掉没有意义的值(NaN),保留有意义的特征;降维;
-
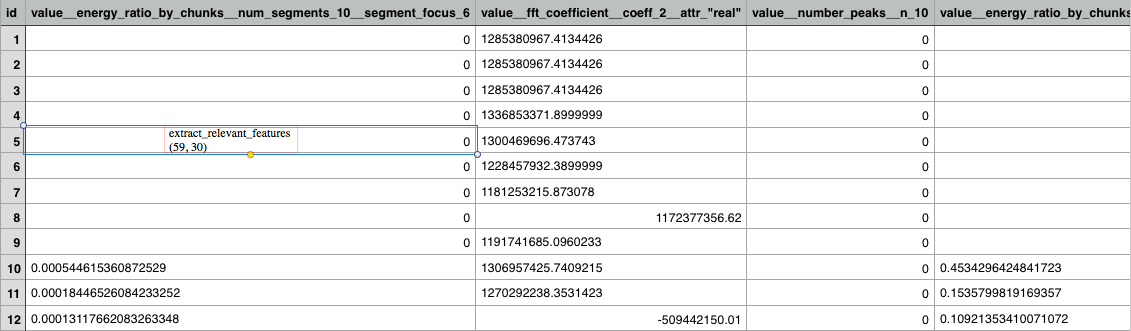
特征提取和过滤同时进行:extract_relevant_features(timeseries, y, column_id='id', column_sort='time')
案例
源码中的案例
-
https://github.com/blue-yonder/tsfresh/tree/master/notebooks
available tasks
-
time series classification
-
compression
-
forecasting
Time Series Forecasting - jupyter notebook
-
tsfresh.utilities.dataframe_functions.make_forecasting_frame(x, kind, max_timeshift, rolling_direction)
-
x (np.array or pd.Series) – the singular time series;历史数据,
-
kind (str) – the kind of the time series;
-
max_timeshift (int) – If not None, shift only up to max_timeshift. If None, shift as often as possible;
-
rolling_direction (int) – The sign decides, if to roll backwards (if sign is positive) or forwards in "time";
-
Returns:time series container df, target vector y;

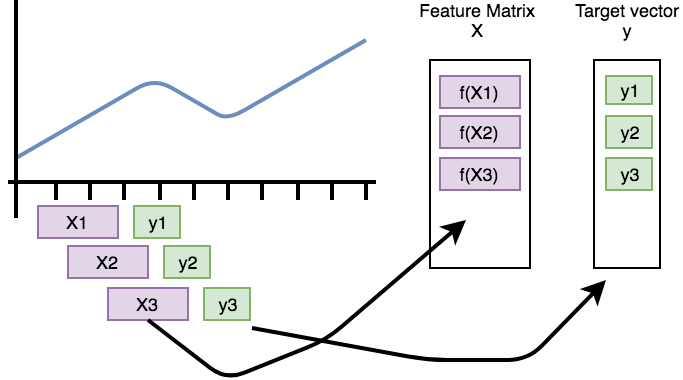
说明:df_shift, y = make_forecasting_frame(class_df_all['y'], kind="gmv", max_timeshift=24, rolling_direction=1)make_forecasting_frame() 函数的滑动过程如上图所示,假如:len(class_df_all['y']) = 59,max_timeshift = 10。
- (max_timeshift + 1)*(max_timeshift/2) + (len(y) - max_timeshift)*max_timeshift
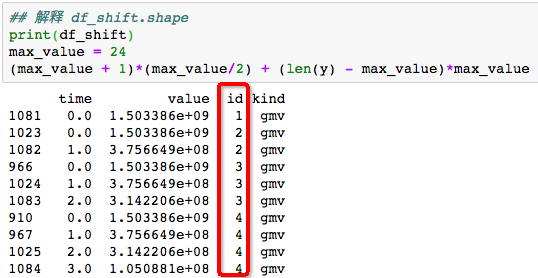
当rolling_direction = 1,那么返回的 df_shift 将是一个545行的组合数据,过程如下:
id = 1:feature_matrix, time = 0
id = 2:feature_matrix, time = 0,1,
id = 3:feature_matrix, time = 0,1,2
... ...
id = 10:feature_matrix, time = 0,1,2,3,4,5,6,7,8,9 ##
id = 11:feature_matrix, time = 0,1,2,3,4,5,6,7,8,9 ## 由于 max_timeshift =10,限制了最大长度为10
id = 12:feature_matrix, time = 0,1,2,3,4,5,6,7,8,9 ## 由于 max_timeshift =10,限制了最大长度为10
... ...
id = 58:feature_matrix, time = 0,1,2,3,4,5,6,7,8,9
所以:545 = (1+10)*10/2 + (59-10)*10
当 rolling_direction = -1 时,过程如下:
id = 1:feature_matrix, time = 0,1,2,3,4,5,6,7,8,9 ## 由于 max_timeshift =10,限制了最大长度为10
id = 2:feature_matrix, time = 0,1,2,3,4,5,6,7,8,9
id = 3:feature_matrix, time = 0,1,2,3,4,5,6,7,8,9
... ...
id = 57:feature_matrix, time = 0,1
id = 58:feature_matrix, time = 0
 683·380
-
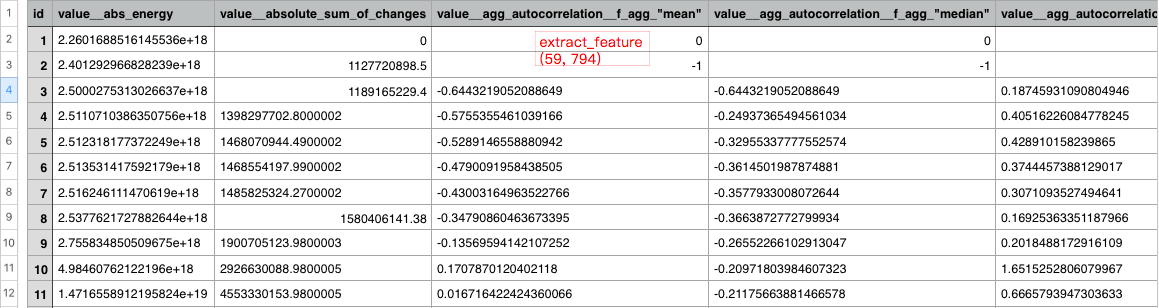
extract_features,特征提取:根据上述滑动组合得到的 df_shift 数据,提取特征:X = extract_features(df_shift, column_id="id", column_sort="time", column_value="value", impute_function=impute, show_warnings=False) ## 在 spyder 上无法work,而在 jupyter notebook 可以 work;
-
得到的特征:[59 rows x 794 columns] --> 794 维的特征,59行样本数
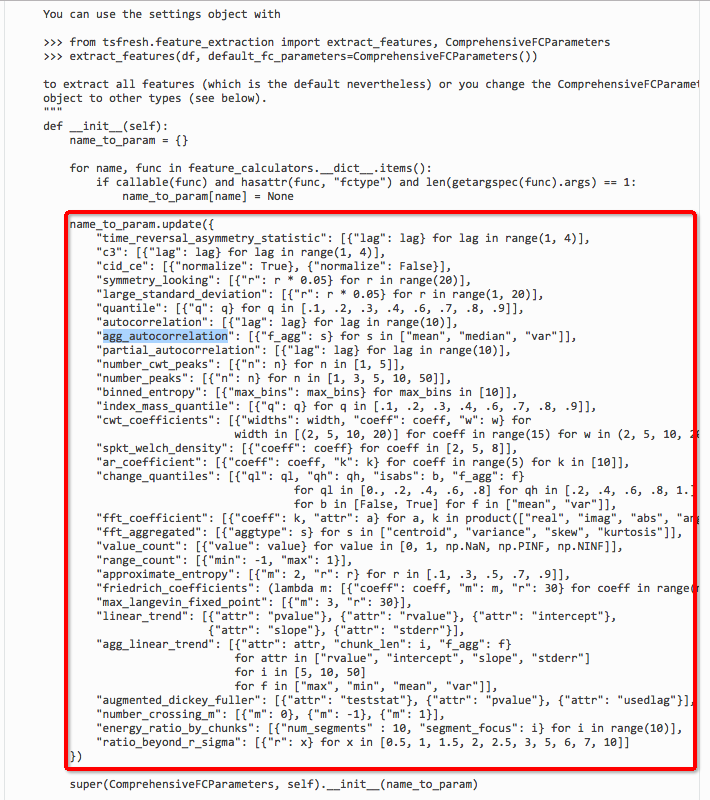
(794维特征,class ComprehensiveFCParameters)
-
extract_features 提取特征的对象:
1)a pandas.DataFrame containing the different time series;
2)a dictionary of pandas.DataFrame each containing one type of time series;
- extract_relevant_features:过滤掉部分特征
思路问题
回归模型
-
输入:特征向量 - feature
-
输出:预测值(回归值)
-
问题:gmv是目标值,如果数据仅仅是(ds,gmv),是否不适用回归模型?
-
分析:回归模型的输入是特征,如果需要预测未来2个月的gmv值,那么需要知道未来2个月各自对应的特征向量 feature,并将 feature 作为模型的输入,得到对应的预测值。
Script - 20180717
import numpy as np
import pandas as pd
import matplotlib.pylab as plt
import seaborn as sns

from tsfresh import extract_features
from tsfresh.utilities.dataframe_functions import make_forecasting_frame
from sklearn.ensemble import AdaBoostRegressor
from tsfresh.utilities.dataframe_functions import impute

import warnings
warnings.filterwarnings('ignore')

## load dateset

month_list = ["Jan","Feb","Mar","Apr","May","June",
              "July","Aug","Sept","Oct","Nov","Dec"]

all_leaf_class_name_dict = {cate_id: cate_name}

df = pd.read_csv('./cate_by_month_histroy.csv', header=0, encoding='gbk')
df.columns = ['ds', 'cate_id', 'cate_name', 'y']
class_df_all = df[df.cate_name.str.startswith(cate_name)].reset_index(drop=True)
class_df_all = class_df_all[['ds', 'y']]
class_df_all = class_df_all[:60]
# print(class_df_all.head())

## plot
fig = plt.figure(facecolor='white')
ax = fig.add_subplot(111)
ax.plot(class_df_all['ds'], class_df_all['y'])
for tick in ax.get_xticklabels():
    tick.set_rotation(90)
fig.set_size_inches(18, 8)
plt.legend()

## make_forecasting_frame
df_shift, y = make_forecasting_frame(class_df_all['y'], kind="gmv", max_timeshift=24, rolling_direction=1)
# print(df_shift)
# print(y)

## extract_features
X = extract_features(df_shift, column_id="id", column_sort="time", column_value="value", impute_function=impute,
                     show_warnings=False)

## 回归模型
ada = AdaBoostRegressor()

y_pred = [0] * len(y)
# print(y_pred)
y_pred[0] = y.iloc[0]
# print(y_pred[0])

ada.fit(X.iloc[:], y[:])
y_pred = ada.predict(X.iloc[:])
print((X.iloc[:]).shape)
# for i in range(1, len(y)):
#     ada.fit(X.iloc[:i], y[:i])
#     # print(len(X.iloc[i, :]))
#     y_pred[i] = ada.predict(X.iloc[i, :])

y_pred = pd.Series(data=y_pred, index=y.index)

plt.figure(figsize=(15, 6))
plt.plot(y, label="true")
plt.plot(y_pred, label="predicted")
plt.legend()
plt.show()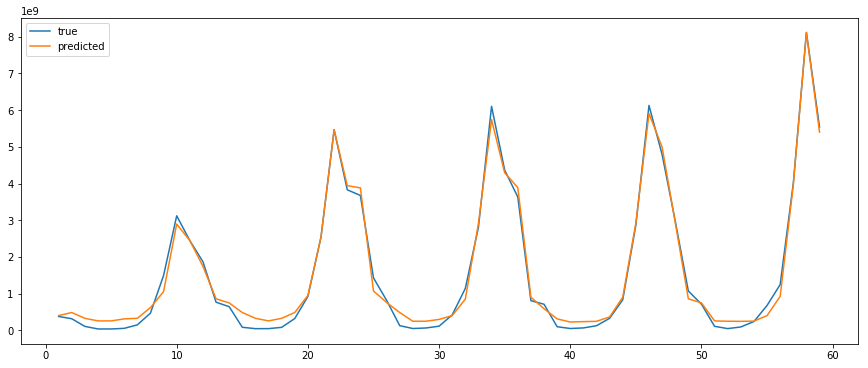
问题汇总
-
ImportError: cannot import name 'is_list_like':https://stackoverflow.com/questions/50394873/import-pandas-datareader-gives-importerror-cannot-import-name-is-list-like
-
extract_features:Anaconda-spyder 执行到 extract_features 命令时,跑不动(编译器问题?),如下图所示:

-
extract_features:使用 jupyter notebook 就能顺利跑动,如下图所示:
