1.随机生成二维聚类数据
- import numpy as np
- x1 = np.array([1, 2, 3, 1, 5, 6, 5, 5, 6, 7, 8, 9, 9])
- x2 = np.array([1, 3, 2, 2, 8, 6, 7, 6, 7, 1, 2, 1, 3])
- x = np.array(list(zip(x1, x2))).reshape(len(x1), 2)
- print x
- # [[1 1]
- # [2 3]
- # [3 2]
- # [1 2]
- # [5 8]
- # [6 6]
- # [5 7]
- # [5 6]
- # [6 7]
- # [7 1]
- # [8 2]
- # [9 1]
- # [9 3]]
2.生成聚类标签
- from sklearn.cluster import KMeans
- kmeans=KMeans(n_clusters=3) #n_clusters:number of cluster
- kmeans.fit(x)
- print kmeans.labels_
- #[0 0 0 0 2 2 2 2 2 1 1 1 1]
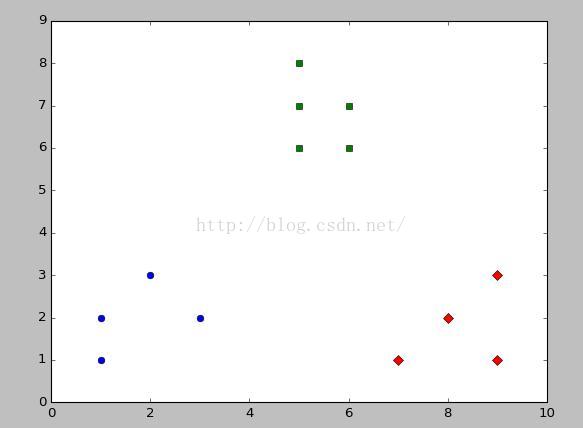
3.显示聚类效果
- import matplotlib.pyplot as plt
- plt.figure(figsize=(8,10))
- colors = ['b', 'g', 'r']
- markers = ['o', 's', 'D']
- for i,l in enumerate(kmeans.labels_):
- plt.plot(x1[i],x2[i],color=colors[l],marker=markers[l],ls='None')
- plt.show()